IELTS Writing
- Writing Introduction
- Task 1
- Task 2
Introduction to Writing Beginners Lessons
The purpose of the lessons is to acquaint you with the various aspects of the writing module. You will be acquainted with the features of the two tasks to be attempted in the given one hour.
There are lessons designed to inform you about the different task types and the requirements of the task. The exercises are designed for skill-building.
These are not a part of IELTS but will help you in developing an understanding of the tasks and in writing your answers.
The lessons will include the following:
- An overview of the tasks
- An understanding of the format
- The different question types
- Skill-building exercises
- Complete writing tasks for practice
The skill-building exercises have an answer key to check your answers and the complete task questions include sample answers for your reference.
IELTS Writing Introduction
A candidate attempts for either IELTS Academic or General depending on the status of their application. Students aspiring for higher studies have to appear for IELTS Academic whereas professionals opting for Permanent Residence or employment have to undertake IELTS General
IELTS Writing is a one-hour test. The one hour test is divided into two tasks, Task 1 (20 minutes) and Task 2 (40 minutes). (This is the suggested time allocation.)
The IELTS Writing test has two tasks. Task 1 is of different types for both the IELTS Academic and IELTS General and Task 2 is of the same type. IELTS
Writing Task 1: REPORT WRITING (IELTS Academic), LETTER WRITING (IELTS General).
IELTS Academic (Report Writing) | |
Question types: |
|
Task requirement: |
|
IELTS Writing Task 2: ESSAY
Task question types:
- Opinion (Agree or Disagree)
- Advantages and Disadvantages
- Problem and Solution
- Discussion (Discuss both views)
- Two-part Question
Task requirement: Minimum 250 words to be written.
N.B: In the assessment, Task 2 is worth twice as much as Task 1 in the IELTS Writing test.
WRITING TEST ASSESSMENT:
Task 1: Report Writing (Academic)
In this task, the candidate needs to summarize the information provided in the graph or the diagram and should not present any of his/her opinions.
Also, not all the information given in the chart has to be written, but the major changes should be specified, and comparisons should be made wherever relevant.
Task 1: Letter Writing (General Training)
In this task, the candidate is asked to respond to a given situation through a letter of request, explanation or complain, explaining the situation, requesting or making suggestions.
Here, candidates are assessed on the following criteria:
- ability to engage in correspondence
- draw and provide general facts and information
- express opinions – views, complaints, likes and dislikes etc.
Task 2: Essay
In this task, the examiner assesses the candidate’s ability to express his/her opinion on a particular topic by quoting relevant examples either from one’s knowledge or the surroundings.
Task 2 questions are open-ended questions. There is no right or wrong answer. Candidates are expected to address the task presented to them and support their response with relevant reasons and/or examples
Questions will be based on topics of general interest and awareness, such as – education, environmental issues, etc.
THE BELOW MENTIONED POINTS SHOULD BE NOTED FOR IELTS WRITING TASK 1 & 2 (ACADEMIC & GENERAL TRAINING)
Task Achievement/Response: In the IELTS Writing, Task 1 and 2 questions will have 2 to 3 points to consider. If the candidate fails to address any issue or point mentioned in the question, the task will be considered incomplete leading to a drop in score. Lexical Resource: It assesses the candidate’s ability to use less common vocabulary and not to use repetitive words or phrases. Also, the skill to use appropriate collocations in the sentence structure is assessed. Coherence and Cohesion: All the ideas should be logically arranged, and the sentences and paragraphs should have a link. Cohesive devices should be used fluently and flexibly. Grammatical Range and Accuracy: Basic grammar, sentence structure and spelling should be correct, with appropriate use of punctuation. The use of a range of sentence structures flexibly and with minimum errors is assessed. |
- Understanding the task
- Bie Chart
- Line Chart
- Pie Chart
- Table Chart
- Flow Chart
- Process Chart
- Diagram
- Map
- Understanding task 1
- Interpreting a chart
- Writing the introduction
- Writing the general statement overview
UNDERSTANDING WRITING TASK 1- REPORT WRITING
You will be given some information in the form of a diagram, table, graph or a chart to test your ability to understand and to report the given information in your own words. The presentation must be in complete sentences, not in bullet points. The minimum word limit is 150 and the suggested time is 20 minutes. Your task is to report the information, summarising it and making comparisons where relevant. Also, do not give an opinion, make assumptions or draw a conclusion about the information provided, as they are not asked.
Types of Task 1
- bar graph
- table
- pie chart
- line graph
- diagram (equipment/machine/object)
- diagram of the stages of a process
- a sequence of events/a procedure how something is done
- map/diagram
There might be a combination of any one or two types of pictorial illustrations.
PLAN THE NUMBER OF PARAGRAPHS
First of all, you must fully understand the given task. Invest one or two minutes to plan the number of paragraphs and the points to respond. You are required to compare the provided data. Support the comparison with the help of the data provided in the diagram while taking care to report the main features. For better planning, look at the diagram for some special features or eye-catching point. You should use approximately 20 minutes to finish writing, including the time to proofread at the end. Remember, the weightage for Task 2 is twice that for Task 1. Do not invest too much time on Task 1.
You can write either 3 or 4 paragraphs, although paragraphing may not always be required. You must make your mind before you begin to write. Note that in Academic Writing Task 1 you do not need to write a separate paragraph as a conclusion. You must also decide what the main topic of each paragraph will be before you start to write.
To start with, you will need an introductory paragraph describing the pictorial in brief. However, an introduction that is too short or a one-liner will not satisfy the requirement of the first paragraph.
In some cases, it is a good idea to join together the introduction and an overview statement.
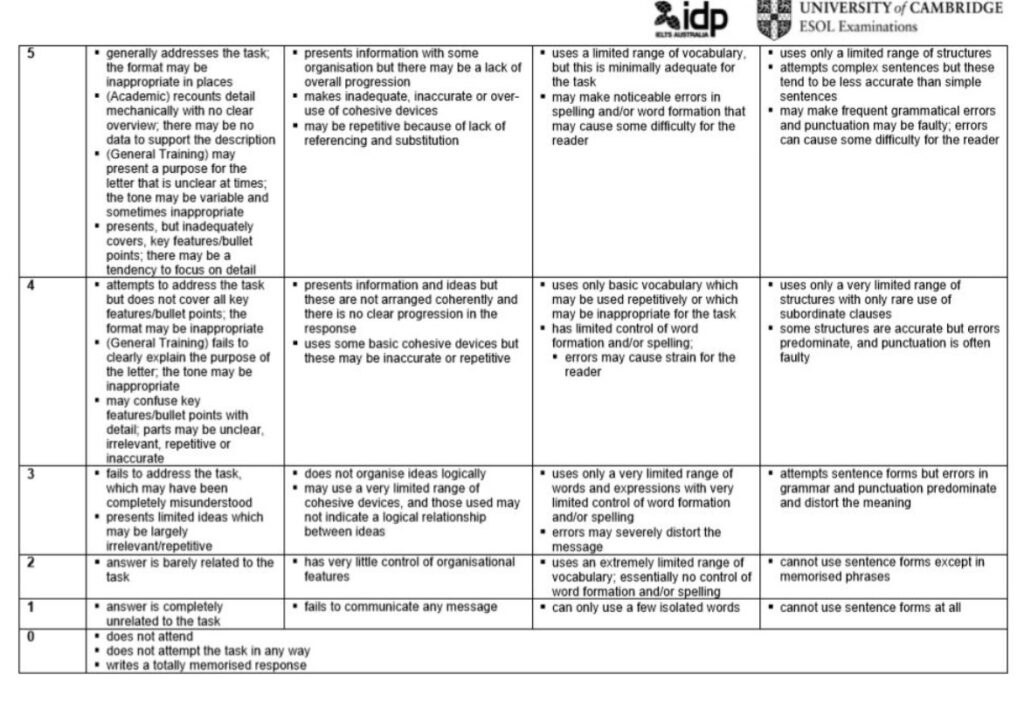
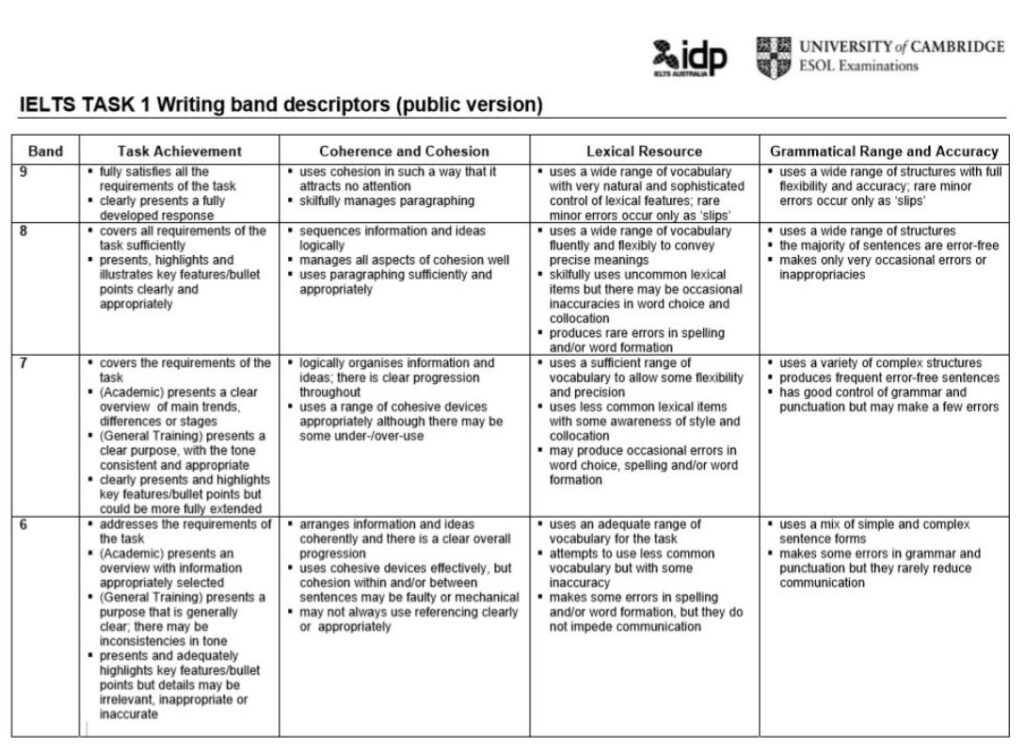
IELTS Band Descriptors
IELTS test has band descriptors which state the proficiency level of the candidate. In simpler words, it helps in determining whether the candidate is an expert user, intermediate or beginner in the English Language
A Band descriptor is divided into 9 levels along with the four components by which an examiner judges the candidate for accomplishing the set of requirements described in it.
This is helpful for the candidates because it will enable them to know what the examiners are looking for in their answers which in turn avoids losing any score.
Interpreting a chart
Line charts, bar charts, and tables often show changes over a period of time, and how quickly or how slowly these changes happen. They can also tell you how big or how small these changes are.
A lot of the information you are likely to see in the IELTS Task 1 writing test can be expressed using two lines, the x-axis (horizontal) and the y-axis (vertical). This forms a chart where the rest of the information can be added.
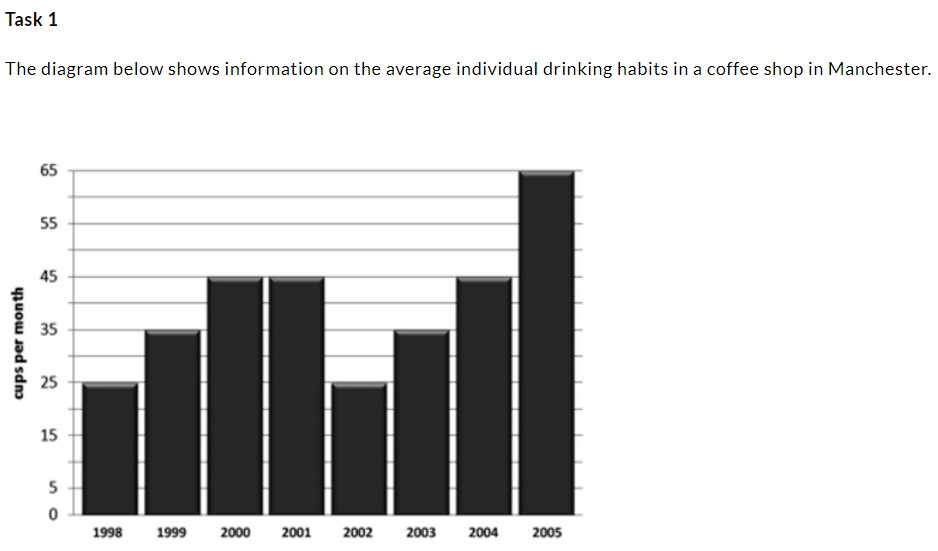
Task 1
X-axis
This will usually show the passing of time in:
- Hours
- Days
- Weeks
- Months
- Years or even decades
Y-axis
This will show what changes over a period of time:
- The number of cars exported to the US
- The cost of public transportation
- The amount of electricity used per household, etc.
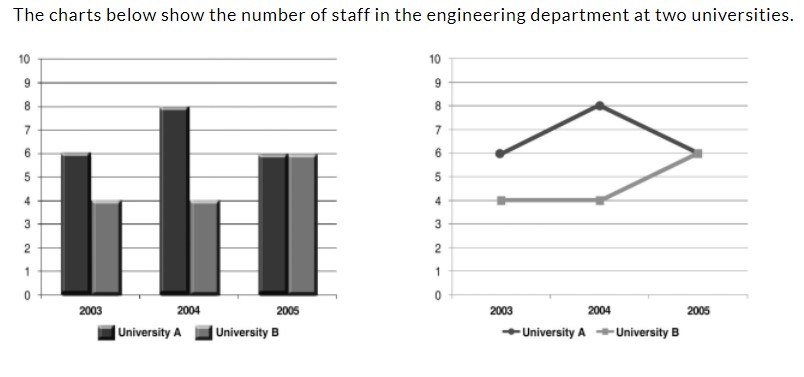
The charts below show the number of staff in the engineering department at two universities.
Exercise
Note that the bar chart and line chart show exactly the same information. Use the information in the bar chart and line chart above to complete the table below.
Table
Fill in the number of staff in the two universities during the three years.
2003 | 2004 | 2005 | |
University A | |||
University B |
Before you write your answer, you need to read the graph and interpret it properly to be able to write a well-developed report. For writing the introduction, you need to select the basic information from the question. For the overview, you need to write a general trend. For writing the main body, you need to read the complete data and select the most important features. You should not write about everything in the graph. This will make your answer too long and you will not achieve the task given to you as the question statement clearly states that you need to summarise the data by selecting and reporting the main features. It does not ask you to include every detail.
Show Answers
2003 | 2004 | 2005 | |
University A | 6 | 8 | 6 |
University B | 4 | 4 | 6 |
Writing The Introduction
When writing the introduction, it is useful to remember that you are answering the question, “What is it?”, in other words, “What type of information does the chart show?” The more clearly you answer this question, the better your introduction is likely to be.
Important Tips
Points to consider:
• COPYING – You should not copy the introduction given in T1 question, even if you include small sections from it, the examiner will still see it as a problem. Also, these words will not be counted if presented ditto. (copied exactly the same)
• NOT WRITING ENOUGH INFORMATION – This may take the form of either leaving out information already provided in the Task 1 introduction or not finding all of the extra information from the chart.
• Remember always to include the type of graph, time period, what the data is about. names/number of categories AND look for the units. You do not have to put the units in the introduction (although you can) but check for units when you first look at the chart because you might forget later.
•Do not include the word below or a synonym of it, because this would not be true.
Remember that you are writing on the exam paper and this has no diagram on it.
Make sure you look for:
“the type of chart – bar chart, graph, table, and so on
“a time period. Remember that not all charts have time periods.
“the type and number of categories
“the units
Exercise
Pick the best introduction for this diagram from the list below. What do you like or dislike about each sentence? What would you change and why?
- The bar chart provides data on the number of coffee consumed per person per month in a typical Manchester coffee shop over a 7-year period from 1998 to 2005.
- The chart presents information on the amount of coffee in a typical Manchester coffee shop.
- The bar chart provides information on the average amount of coffee consumed per person in a typical month in a Manchester coffee shop over an 8-year period from 1998 to 2005.
- The bar chart below shows the monthly consumption of coffee in a Manchester coffee shop over an 8-year period from 1998 to 2005.
Writing the Introduction
The best introduction for the Task 1 diagram is sentence number three:
The bar chart provides information on the average amount of coffee consumed per person in a typical month in a Manchester coffee shop over an 8-year period from 1998 to 2005.
It contains all of the necessary information that the examiner looks for and also shows the ability to use the phrase – the amount of – correctly.
Many students get confused with – the amount of/the number of/levels of – and make errors in word choice. Practice this skill by completing the exercise below.
Exercise
Now write an introductory sentence using each piece of information below.
- The chart below shows information about different cities and their population.
(1997-2007/New York, Tokyo, London, Rome/table)
- The chart below shows Internet usage in various states in America.
(1985-2003/California, Oregon, Florida, Colorado, Ohio, Alaska/bar chart)
USE REFERENCE STRUCTURES
When referring to a pictorial, use “reference” structures to assist the reader to know where the information comes from and it will also effectively lead to what you want to say. Some “reference” structures are given below.
table/chart, diagram graph | shows (that).describes illustrates compares (that)… | ||
|---|---|---|---|
The | figures statistics | shows (that). compares (that)… | how……. |
diagram | Show describes illustrates |
According to the As (is) shown in the As can be seen from the | table/chart, diagram, graph, figures, | ………………… |
It can be seen from the We can see from the | table/chart diagram graph figures | (that)….. |
It is | clear apparent | from the | table/chart diagram graph figures | (that)… |
Exercise
It is important to be able to use these phrases appropriately and in the correct word order. Look at the table below and see if you can match the different categories with the right grammatical expression. Note that many words can be used more than once.
The number of…. | The amount of…. | Levels of… |
accidents children coffee life expectancy free time electricity pollution income students |
Show Answers
The table provides data on changes in the levels of population growth in four different cities over an 11-year period from 1997 to 2007.
The bar chart highlights information on changes in the frequency of Internet usage in six different states in America over a 19-year period from 1985 to 2003.
The number of ......
accidents, children, students
The amount of
coffee, electricity, free time, income, pollution
The levels of .....
life expectancy, income, pollution
Writing the General Statement Overview
After writing the introduction, you now need to write a statement that describes the main idea or trend of the diagram. This is called an Overview. It can be included in the first paragraph with the introduction or can be written as a separate paragraph.
This is a general statement, which means that it should only provide an overview of the given chart and should not be too specific or detailed.
Remember: Preferably, no figures are used in this statement.
Important Tips
The OVERVIEW can focus on a trend or the information in general such as the time period/age groups, and maximum and minimum figures if there is no specific time period… Do NOT add figures from the main body in the overview statement. |
When writing a general statement, both the simple present and simple past verb tenses can be used. However, it is more usual to use the simple past.
Exercise
Look closely at the table and decide what would make a good general statement.
2003 | 2004 | 2005 | 2005 |
University A | 6 | 8 | 6 |
University B | 4 | 4 | 6 |
Exercise
Notice which universities have experienced an increase in the number of staff according to the table below.
Task 1
The chart below shows the number of staff in the Engineering Department in three universities.
2003 | 2004 | 2005 | 2005 | 2007 | 2007 |
University A | 6 | 8 | 6 | 9 | 8 |
University B | 4 | 4 | 6 | 10 | 9 |
University C | 5 | 7 | 6 | 8 | 3 |
As you look more closely at what happened over the 5 years, from 2003 to 2007, you can see that the number of staff in each university has fluctuated. You cannot, however, use words such as:
The number of staff went up and down … /The number of staff fluctuated.
These statements, although true, display poor word choice. Such a statement is descriptive but is missing an overall trend
To find a trend for each university, simply look at the number of staff employed in 2003 and then the number of staff in 2007. DO NOT look at any of the other years. Did employment figures increase or decrease for each university?
A useful way to write an overview is by dividing the categories into different groups. You should have found that the staff in University A increased, University B increased, and University C decreased. This information can now be turned into a general statement (overview):
In general, staff in the engineering departments of Universities A and B rose but figures fell for University Cover this period of time.
How would you word your overview statement?
Exercise
Task 1
Look at the table again and see if one university always, or nearly always, had more staff than the others.
University B had more staff in every year, and so this could be used to write the general statement with the main idea:
An overview of this chart shows that University B always had more staff than the other two universities over this period.
In some sample answers, you may find a conclusion. In this type of writing a general statement and a conclusion are very similar and repetition of information is difficult to avoid. It is preferable to write an overview rather than including a conclusion.
- Skill building exercise 1
- Skill building exercise 2
- Exercise 1
- Exercise 2
Writing Task 1- Main Body - Analysing
When we first look at the bar chart shown below it seems as if it is going to be very difficult to analyze.
Figures increase in regular steps from 2001 to 2010, and nothing seems to stand out as being very different.
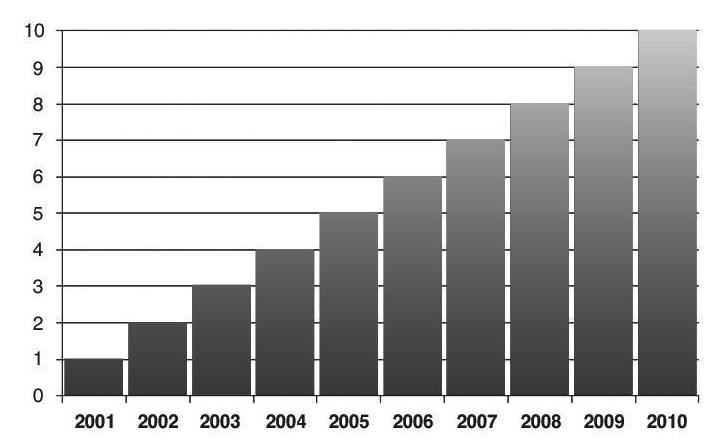
However. to analyse well, it is important to be able to move past the initial impression and start to focus on different parts of the chart. Do not just look at the years in order. Jump from one year to another and see what can be compared and contrasted. You can use a pencil to help you make these connections.
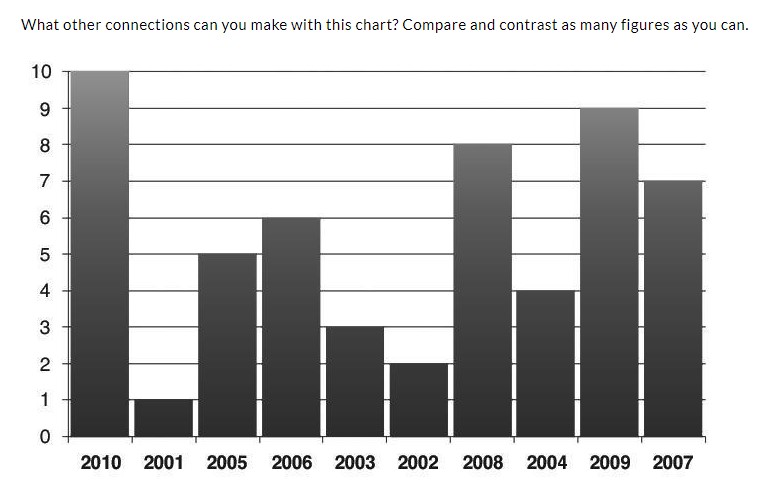
Now look at the second bar chart and see how these connections have been made. To make it easier to understand, the actual years have been moved on the x-axis. Now you can see that year 2010 is next to 2001 because they are the largest and smallest respectively. The year 2005 is next because this is exactly half the largest figure.
Exercise A
Exercise B
Now look at another example and, using ideas from above, write the main body. You can also write an introduction and general statement for extra practice. Remember that one figure may not be, for example, “exactly three times larger” and so you need to use the phrases shown to you from Exercise 5
Task 1
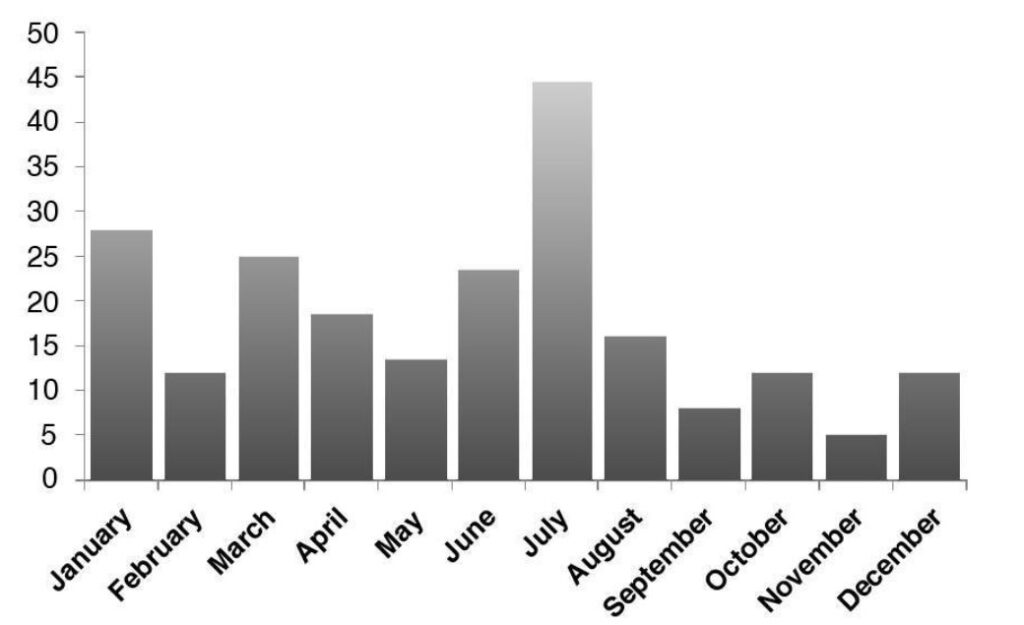
The diagram below shows the number of papers accepted for publication by the Engineering Faculty at Warwick University in 2011.
Summarise the information by selecting and reporting the main features, and make comparisons where relevant.
Write at least 150 words.
Show Answers
Exercise A
- (some examples)
The figure for 2010 is the largest and that for 2001 is the smallest
The figure for 2005 is exactly half that for 2010.
The figure for 2008 is exactly double that for 2004.
The figure for 2001 is exactly a third that for 2003.
The figure for 2002 is exactly a quarter that for 2008.
Exercise B
The bar chart provides data on the number of papers taken for publication from Warwick University's Engineering Faculty for the 12 months of 2011.
Despite fluctuations and a notable peak in July, there was an overall downward trend during the year.
In January there were about 27 papers accepted for publication; this was the second highest number for the year. The following month there were only 11 papers taken. That figure rose to 24 in March but then fell again over the next two months. From 13 papers in May the number rose sharply to a yearly peak of 44 papers in July.
In August, only 15 papers were accepted, a little more than a third of the total for the previous month. Over the last four months of the year, the number of accepted papers remained below the August figure, reaching a yearly low in November with 6 papers.
Skill Building Exercise 2
Look at the bar chart and start to collect any extra information needed to write the introduction. Also, remember to look for units so that vou know what the figures mean. Now think about the overview statement and see if it is possible to write both the introductory statement and the overview in a single sentence.
You only need to include one type of general statement in your Task 1 essay but being able to write both types helps you to develop your analytical skills.
Being able to analyse a diagram properly is essential if you want to get a good grade.
Task 1
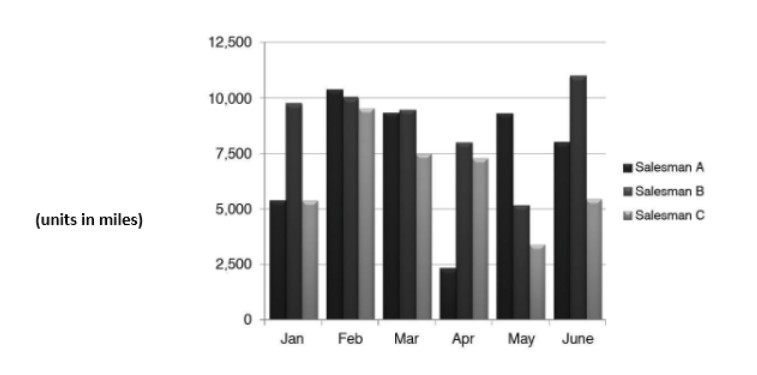
The table below shows how far different salesmen travelled in 6 months in 2010.
Exercise
Now think about the main body and try (it might not always be possible) to write sentences for the key features listed below. Remember to put figures into each sentence.
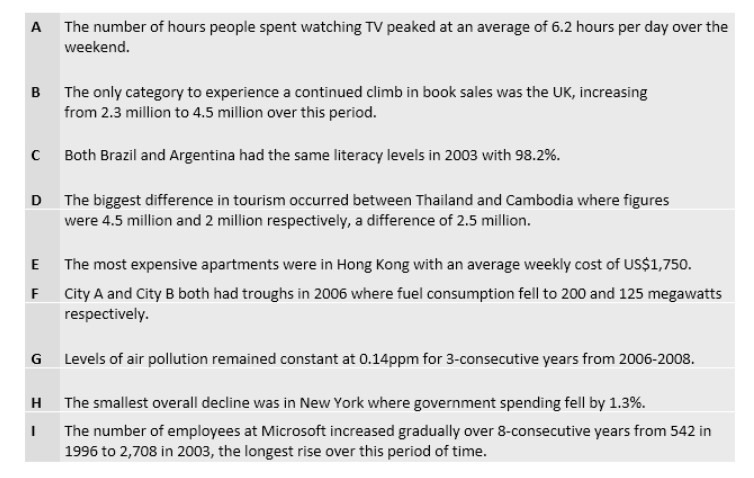
Key Features
- The extremes (the biggest and the smallest)
- The constant (no change)
- The longest continued rise/fall over a period
- The only category to always rise/fall
- A peak
- A trough
- Biggest / smallest increase / decrease
- Two categories the same / two points the same in one category
- Comparison between two categories
Remember:
Perfect grammar and perfect spelling won’t get you a perfect grade if your interpretation of the data is unclear.
Show Answers
The bar chart shows the information on the changes in the number of miles travelled by three different salesmen over a 6-month period in 2010.
Overview Statement Trend
Overall, mileage increased for both salesman A and B but, despite clear fluctuations, salesman C had the same figures in January and June.
General Statement Main Idea
In general, salesman B tended to travel more miles than either salesman A or salesman C over this period.
- The furthest distance travelled was in June by salesman B with a mileage of slightly under 11.000 miles.
- The biggest decrease was from a little under 10.000 miles in February to just under 2,500 in April by salesman A.
- The largest peak for salesman A was in February with a figure of a little over 10,000 miles.
- The lowest trough was also for salesman A when figures fell to a little under 2,500 miles in April.
- In January, mileage for both salesmen A and C were the same at slightly more than 5,000.
- The smallest decrease over two consecutive months was for salesman C with the distance travelled falling from exactly 7,500 miles to slightly less than 7,500.
WRITING TASK 1
You should spend about 20 minutes on this task.
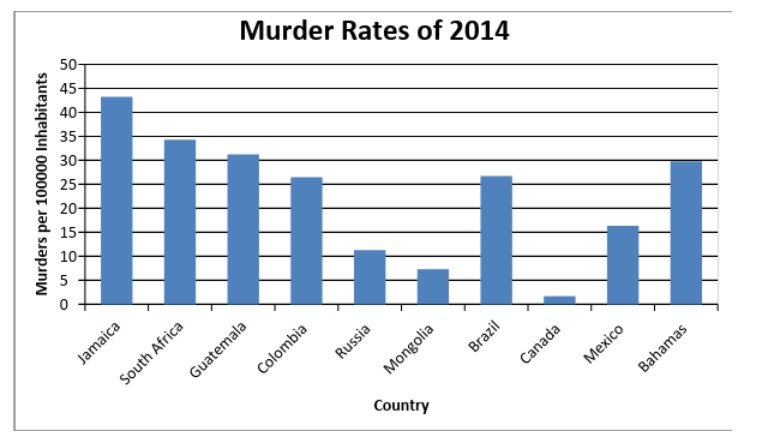
The graph below shows the number of murders per 100, 000 inhabitants in different countries, according to a report in 2014.
Summarise the information by selecting and reporting the main features, and make comparisons where relevant.
Write at least 150 words.
Show Answers
The bar graph compares the rate of reported murders in 2014 in ten different countries. The numbers are given as murders per 100, 000 citizens of each country. Overall, murder ratio varies in different regions of the world and the rate in Canada is almost nil. It is evident that the murder rates in most countries ranged between 25-45 approximately. The number of murders per 100,000 people in Columbia and Brazil in the high-ranging category was just over 25. The Bahamas was next in line, higher by about 5 murders. South Africa and Guatemala registered in 30-35 homicide range with a negligible difference. Surprisingly, Jamaica had the highest murder rate with the figure reaching over 40, although most other countries were not far behind. The murder rates in the low-ranging countries were less than half in comparison, where Canada recorded a strikingly low murder rate of only 1 or 2 per 100, 000 in 2014.
(155 words)
Writing Task 1
You should spend about 20 minutes on this task.
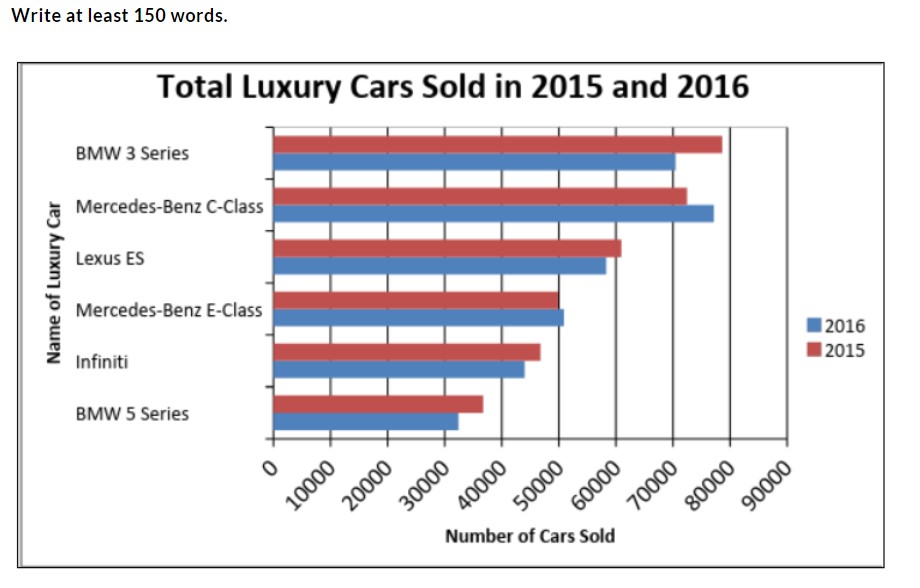
The bar graph represents the number of luxury cars sold in 2015 and 2016 in a country.
Summarise the information by selecting and reporting the main features, and make comparisons where relevant.
Show Answers
The horizontal bar graph compares the sales proportion of luxury cars sold in 2015 and 2016.
Overall, it can be seen that except for Mercedes-Benz, all other models showed a marginal decline in sales in the final year.
The highest sale was recorded for BMW 3 Series in 2015. The figures almost touched the 80,000 mark. While the Mercedes-Benz C-Class overtook to the leading position in 2016, gaining by around eight thousand. BMW 3 Series sales had dropped parallelly, pushing it to the second position after a year.
Surprisingly, in both years, the BMW 5 Series had the least number of purchasers in 2015 at approximately 40,000, which further reduced to almost 30,000 in the second year. The model Lexus ES witnessed sales in the 60,000 range; however, a slight decline was recorded in 2016. The Mercedes-Benz E-
Class sold around 50,000 cars in 2016 to maintain the lead over Infiniti cars which recorded sales figures of 45,000 and lower in successive years.
- Skill building exercise 1
- Skill building exercise 2
- Skill building exercise 3
- Exercise 1
- Exercise 2
Writing Task 1- Main Body - Describing a Diagram
Remember, being able to describe a diagram accurately is an important skill to learn if you want to get a good grade on the IELTS test. It is essential, as you have already seen that you learn how to use adjectives and adverbs correctly, but it is also important to be able to calculate figures accurately.
For instance, if you look at the diagram below and the figure for 1995, you can see that the figure is exactly 300. Many students still write phrases like – university admissions in 1995 were roughly 300 – this is wrong. Be accurate and write – university admissions in 1995 were exactly 300
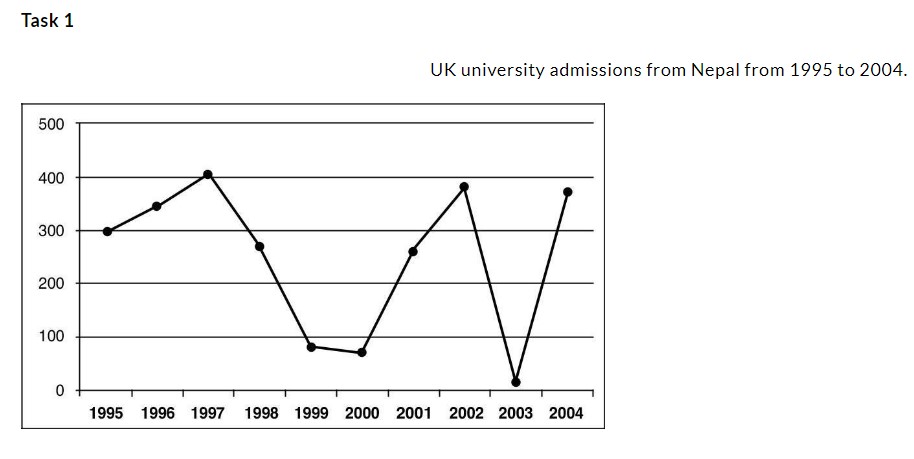
If you now look at 1996, what do you think the figure is? A sentence stating – university admissions in 1996 were exactly 345 – is too accurate and would be seen by the examiner more as a guess than an accurate analysis of the diagram. You can use phrases like the ones below to write about figures that cannot be expressed with absolute certainty.
- a little under
- a little over
- just under
- just over
- slightly less than
- slightly more than
Exercise 1
Look at the chart again and write the introduction, general statement and main body by describing what happens each year.
Show Answers
The line chart provides data on the changes in university admissions from Nepal in the United Kingdom over a 10-year period from 1995 to 2004.
Generally speaking, despite obvious fluctuations, admissions increased slightly over this period.
More specifically, university admissions were precisely 300 in 1995. This was followed by a continued rise in figures to exactly 400 in 1997, an increase of 100 students. Numbers then fell to just under 300 in 1998 and a little less than 100 in 1999. A further decrease was experienced in the following year with admissions settling at approximately 75. However, the number of students going to the UK had risen to slightly less than 400 in 2002. The following year saw a dramatic drop in figures to almost zero admissions, but numbers then recovered in 2004 with nearly 400 Nepalese students entering the UK to study.
Skill Building Exercise 2
Complete the diagram by reading the main body text.
Task 1
The diagram below shows changes in pollen in New York in 2012. Read the main body below the diagram and draw in the information for San Francisco.
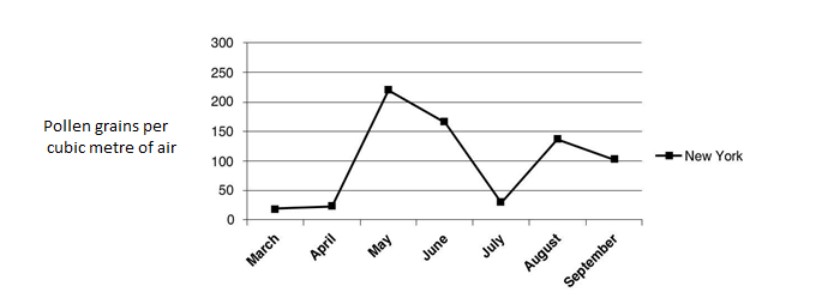
More specifically, pollen levels in New York rose dramatically from slightly below 25 pollen grains per cubic metre of air in March and April to just under 225 in May. During the same period levels in San Francisco increased from precisely 150 to a little under 175 in April but then fell rapidly to just under 100 the following month. This trend then continued, and figures dropped to a low below 75 in June. Similarly, the amount of pollen in New York also declined with a drop, from May to June, of almost 50 grains per cubic metre of air. This pattern was followed by a substantial decrease to just over 25 in July.
However, levels in San Francisco climbed to exactly 100 in July and a little over 200 in August. This trend was mirrored in New York with a rise of a little over 100 grains. Both New York and San Francisco experienced a drop in pollen in the final month to a little over 100 and a little over 175 respectively.
Exercise 2A
Now try to write the introduction and general statement.
Show Answers
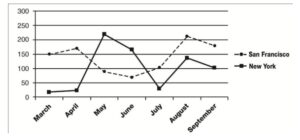
The line chart provides information on changes in the amount of pollen in San Francisco and New York over seven months from March to September in 2012.
Generally speaking, pollen levels rose in both cities over this period.
Skill building exercise 3
Some diagrams use rates as a unit. If you have a diagram like this in your test, you must be careful about how you express the figures. For instance, if the diagram shows the information on literacy rates in various countries, the units might be expressed as, literacy rates per 1000 people. This means that a figure of, for instance, 970 out of 1,000 people are literate. Of course, this could also be expressed as – ‘97% of the people are literate.
Task 1
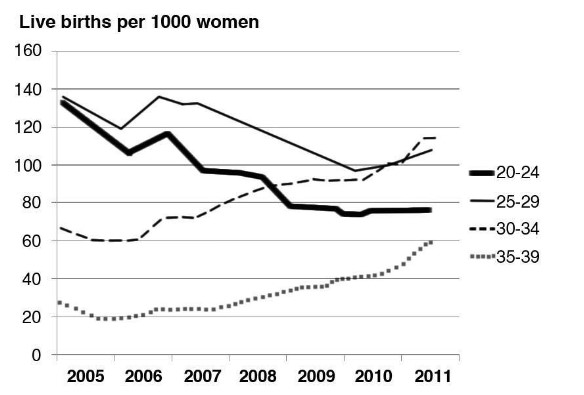
The diagram below shows the information on live births among women of different age groups in the UK.
Look at the two tables below and match 1-4 with A- D to form sentences that describe the line chart. Then put them in the correct order to make the completed main body text. Write an introduction and general statement to complete the essay.
Look at the two tables below and match 1-4 with A- D to form sentences that describe the line chart. Then put them in the correct order to make the completed main body text.
1 | Both the 20-24 and the 25-29 group shared the same rate.. |
2 | The first point to note is that despite increasing almost constantly from a little under 30 live births per thousand |
3 | Women in their early 30s, by contrast, experienced a steady increase |
4 | However, women in their late 20s had rates consistently higher than… |
A | in 2005 to exactly 60 in 2011, the 35-39 age group always had a lower rate of birth than any other groups |
B | all other groups until 2011 |
C | of a little under 140 in 2005 and then followed similar downward trends |
D | in birth rate from just under 70 to just under 120 over the same period and moved from being the third lowest to the highest group from approximately 2011 onwards. |
Show Answers
Best Order - 1C, 2A, 3D, 4B
Writing Task 1
You should spend about 20 minutes on this task.
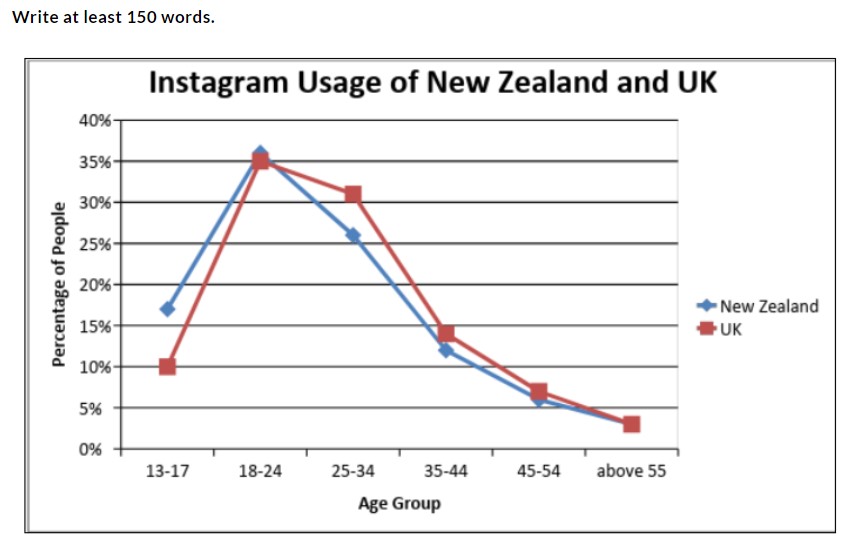
The line graphs below show the percentage of Instagram users according to age in New Zealand and the UK in 2016.
Summarise the information by selecting and reporting the main features, and make comparisons where relevant.
Show Answers
The line graph represents the percentage of different age groups of Instagram users in New Zealand and the United Kingdom. Overall, the youth in both countries are most active on Instagram.
The maximum number of people using Instagram (35%) fall in the 18 to 24 age category. Two age groups display a slight difference in usage while comparing the countries. One is the 25 to 34 demographic, where UK users are relatively high in proportion (about 30% and 25% respectively), and the other is the 13 to 17 age group, where teenage New Zealanders are about 7% more compared to the proportion of UK teens active on Instagram. The least number of users is in the above 55 categories in both countries, as the percentage is less than 5%. The remaining two types show a negligible difference in usage, with the 45 to 54 category having about 6 to 7% of users whereas, the 35 to 44 group has around twice the number of users in both the nations.
169 words
Writing Task 1
You should spend about 20 minutes on this task.
The bar graph represents the number of luxury cars sold in 2015 and 2016 in a country.
Summarise the information by selecting and reporting the main features, and make comparisons where relevant.
Show Answers
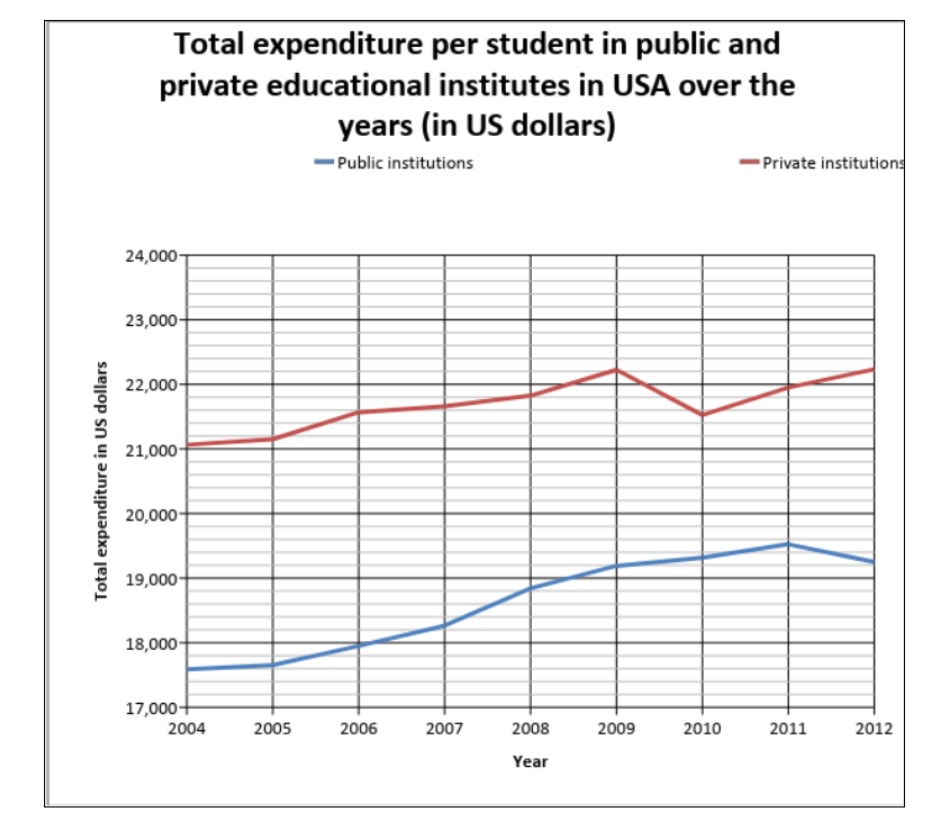
The line diagram compares the amount of money spent by each student in public and private educational institutes from 2004 to 2012. Overall, the education expenditure increased throughout the years; also, private institutes were all-time expensive as compared to public institutes.
The graph shows that a remarkable difference in expenditure was noted from the first year of survey. A student spent $17,600 in public institutes whereas, $21,000 was paid for the private institutes. After 2005, there was a steady rise. The figures for public institutes exceeded from $18,000 to $19,000 by
- Finally, hiking up to about $19,500 in 2011; further, it dropped again in 2012.
Whereas, for private institutes, a gradual increase was seen in the expenditure till 2008 when it reached about $21,600, a bit more than 2004. It surpassed to about $22,200 by next year, after which it dropped down to $21,500 in 2010, finally rose in 2012 again to $22,000.
- Skill building exercise 1
- Exercise 1
- Exercise 2
Skill Building Exercise 1
Exercise 1A
Complete the text below by adding the correct prepositions.
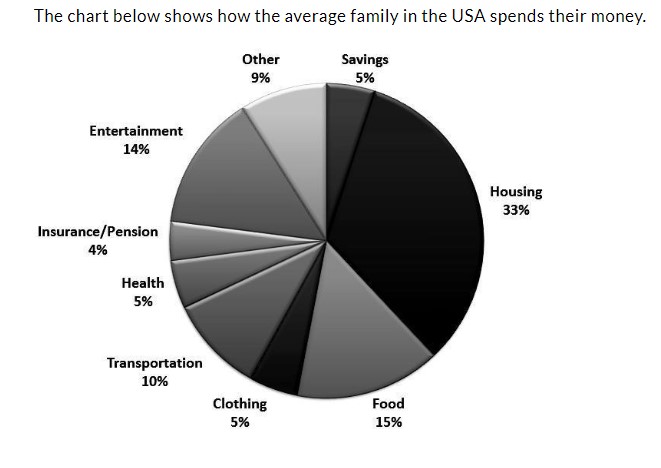
The pie chart provides data 1._____how a typical family 2.___America spends their money 3.____nine different categories. In general, the biggest portion 4.____their budget goes 5.____housing whereas the least amount 6.____money is spent 7._______insurance and pension plans. More specifically, almost one-third (33%) of a family’s total budget goes 8._______their accommodation. This is contrasted 9. _______the 4% that is allotted 10.______insurance or pensions. Exactly 5% of the total income was spent on each of three categories clothing, health, and savings. The 15% spent 11_____food makes it the second largest expense and is closely followed by entertainment 12.___a slightly lower amount of 14%. The amount given to other overheads is 9% and so slightly less than the 10% spent on transportation. The three largest financial commitments 13.______a family, that is housing, food, and entertainment, total almost two-thirds 14._____the total budget at 62%. For instance, if you look at the diagram below and the figure for 1995, you can see that the figure is exactly 300. Many students still write phrases like – university admissions in 1995 were roughly 300 – this is wrong. Be accurate and write – university admissions in 1995 were exactly 300
Show Answers
- ON
- IN
- ON/IN
- OF
- ON/TOWARD(S)/FOR
- OF
- ON
- ON/TOWARD(s)/FOR
- BY
- FOR/TO
- ON
- WITH
- FOR/OF
- OF
Exercise 1
You should spend about 20 minutes on this task.
The pie charts show the distribution of the people of the USA according to their New Year resolutions in 2012 and 2014.
Summaries the information by selecting and reporting the main features, and make comparisons where relevant.
Write at least 150 words.

The pie diagrams show the proportion of the population of the USA resolving to do various things in 2012 and 2014. Overall, the quitting bad habits resolution showed a positive attitude of the public in the final year.
It elucidates the fact that most of the people in the country resolved to improve their fitness during both the years (32% in 2012 and 29% in 2014). However, the second resolution in 2012 was to focus on financial goals, accounting for 25% of the total population, which was replaced by quitting bad habits in 2014 (at 22%).
18% of the people resolved to travel to places in 2012: this ratio decreased in 2014 by 4%. The proportion of people who decided to spend more time with their family decreased from 11% in 2012 to 9% in 2014. There were only 6% of the people who did not fall under any of the given categories and made other resolutions in 2012; this figure almost doubled in 2014.
(165 words)
Exercise 2
You should spend about 20 minutes on this task.
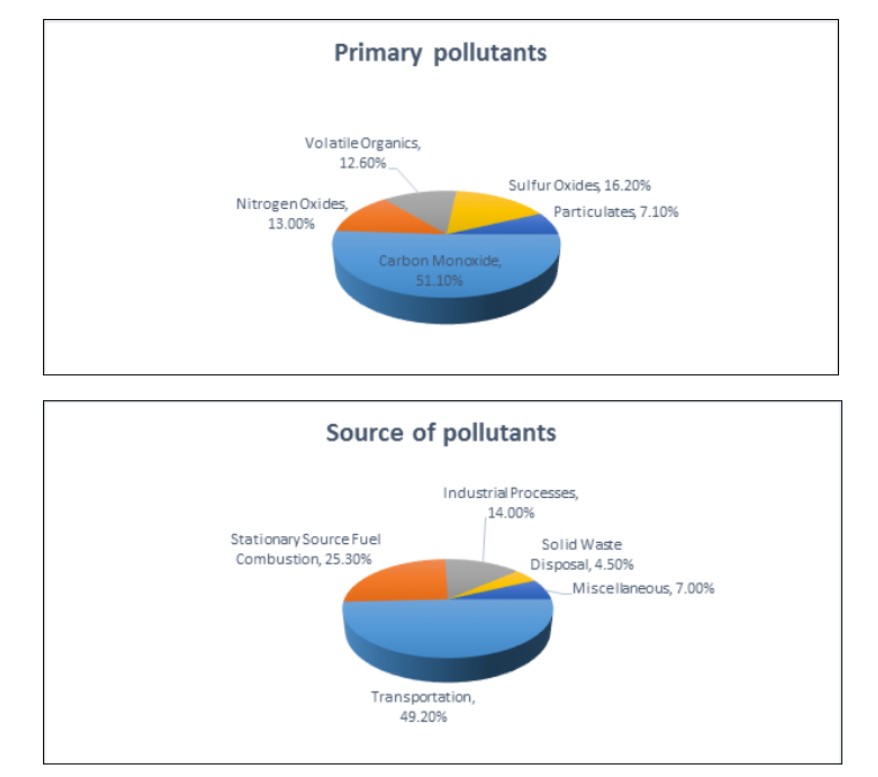
The charts below show the primary pollutants and their sources in four different metro cities across the world in the year 2017.
Summarize the information by selecting and reporting the main features, and make comparisons where relevant.
Show Answers
The pie charts illustrate the percentage-wise contribution of chief pollutants and their sources in four world metro cities for the year 2017. Overall, it can be seen that the major source of air pollution is the vehicular Carbon monoxide discharge
The first pie chart lists the various gases and waste which contaminate the atmosphere. The main reason for pollution is the high ratio of carbon monoxide which makes up 51.10%. The remaining 48.90% comprises nitrogen oxides, volatile organics, sulphur oxides and the other particles present in the air. Of these, sulphur oxides add up for 16.20%, while the particulates contribute the least with just 7.10% of harmful substance. The remaining two pollutants lead to about 13% of pollution.
The second chart confirms the biggest source of pollution is transportation which contributes to almost 50%; while, industries make up only 14% of the total. Combusting fuels risk the surrounding by 25.30% of pollution, solid waste and other miscellaneous pollutant sources jointly make up around 11% of the total pollution.
(174 words)
- Skill building exercise 1
- Skill building exercise 2
- Skill building exercise 3
- Skill building exercise 4
- Skill building exercise 5
- Exercise 1
- Exercise 2
Skill Building Exercise 1
Look at the diagram below and write an introduction and general statement. Remember to look for all of the important information. For extra practice try to write both a general statement trend and a general statement main idea.
Task 1
The diagram below shows information on migration into and out of the UK.
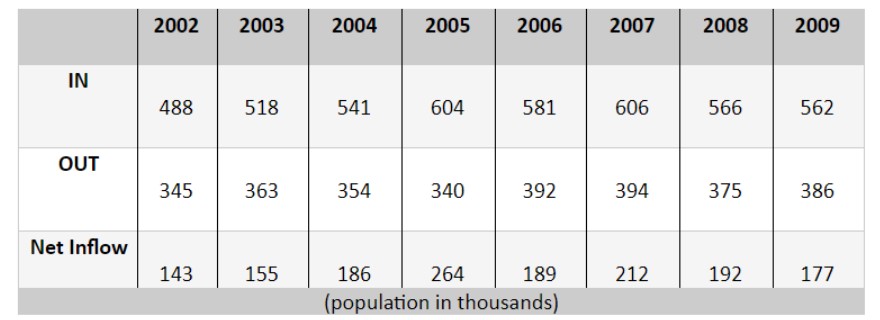
Did you also remember to look for the units? For instance, how many people moved to the UK in 2006? If you said 581 people then you failed to notice the units – “population in thousands”. It is a good idea to look for the units at the same time you look for information for the introduction. You do not need to include the units as part of your introduction but it does ensure you use the correct figures in the main body.
Show Answers
The table compares and contrasts data on migration to and from the United Kingdom over an 8-year period from 2002 to 2009.
General Statement Trend
Overall, migration both into and out of the country increased over this period of time.
General Statement Main Idea
An overview of the diagram shows that figures for migration into the United Kingdom were always higher than for those out of the country.
Introduction
The table compares and contrasts data on migration to and from the United Kingdom over an 8-year period (from 2002 to 2009). Overall, migration both into and out of the country increased over this period of time.
Overview
An overview of the diagram shows that figures for migration into the country were always higher than for those out of the United Kingdom.
Skill Building Exercise 2
Show Answers
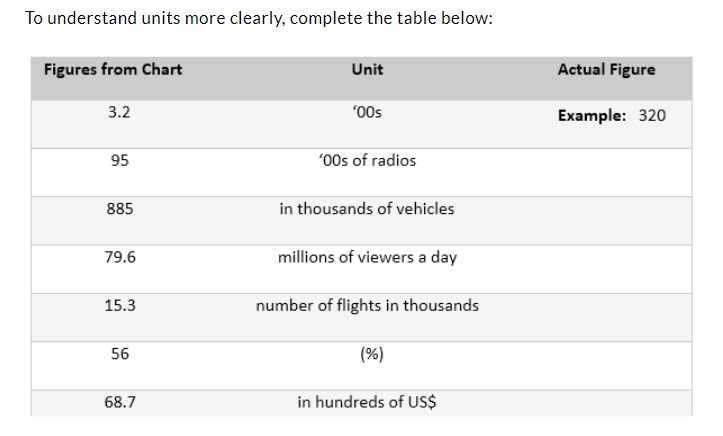
Units
9,500 radios, 885,000 vehicles, 79.6 million viewers a day, 15,300 flights, 56% / 56 per cent / 56 percent, US$6,870
Note that both 'per cent' and 'percent' are correct. 'Per cent' is usually used in British English and percent' is more common in American English. You can use either form; the important thing is to be consistent.
Writing Task 1- Main Body - Accuracy with Numbers
Exercise 3A
The diagram below shows various leisure time activities enjoyed by males and females. Although there is no period, we do have different age groups. This means that it is still possible to state the trend for each activity. Look at the table and decide how many activities increased and how many decreased. Then write an introduction and general statement.
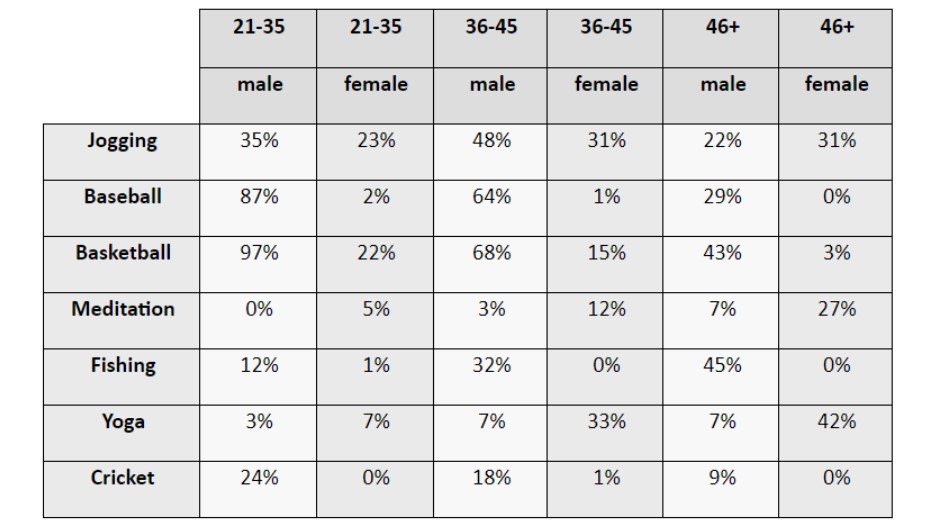
You can see that in the general statement, the terms men and women were used to replace male and female found in the Task 1 introduction. This idea can also be used in the main body to make your writing more interesting. When writing the general statement, you probably realised that there are too many items to list them all. However, you could have written: Overall, a higher percentage of men participated in these activities apart from meditation and yoga which were favoured by women.
Exercise 3B
Look at the sample answer below and find other words or expressions that replace the words male and ‘female.
The least preferred activity for males in the 36-45 age group was meditation with 3% participation whereas 12% of all females surveyed did this activity.
The biggest overall increase in percentage in any activity for women was for yoga which rose from 7% in the youngest age group to 42% in the oldest age group. The opposite sex, however, experienced the biggest change in fishing from 12% to 45% respectively, a total climb of 33%. No change was seen in jogging at 31% in the two older age groups for women. Similarly, their counterparts saw no variation in yoga which remained at 7% in the same two age groups. It is interesting to note that the biggest difference between the two sexes in any one age group and the same activity was for baseball in the voungest age group; men had 87% while the opposite gender had only 2%. (149 words)
Exercise 3C
Which sentence or sentences would you remove to reduce the total length? Why?
Show Answers
Exercise 3A
The table shows information on participation levels of men and women in seven activities over three age groups.
Exercise 3B
Main body with underlined phrases for male and female
The least preferred activity for males in the 36-45 age group was meditation with 3% participation whereas 12% of all females surveyed did this activity.
The biggest overall increase in percentage in any activity for women was for yoga which rose from 7% in the youngest age group to 42% in the oldest age group. The opposite sex, however, experienced the biggest change in fishing from 12% to 45% respectively, a total climb of 33%. No change was seen in jogging at 31% in the two older age groups for women. Similarly, their counterparts saw no variation in yoga which remained at 7% in the same two age groups. It is interesting to note that the biggest difference between the two sexes in any one age group and the same activity was for baseball in the youngest age group; men had 87% while the opposite gender had only 2%.
Exercise 3C
Reducing the Main Body.
The final sentence in the main body could be removed because of the opening phrase - It is interesting to note that.
No opinions can be added to Task 1 writing and doing so can lead to a lowering of your final grade.
Also, the first sentence could be removed as this is not so important. It mentions that participation in meditation was 3% for men in the 36-45 age group, but this is not the smallest overall figure for men in this activity. The 21-35 age group has zero participants and is the lowest figure for any activity for men.
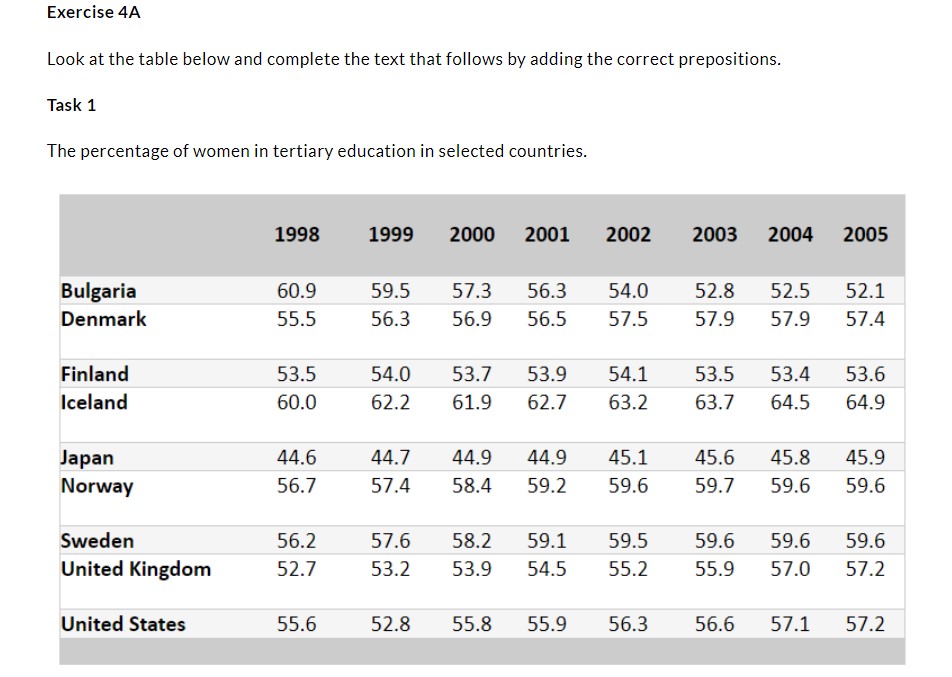
The table provides statistical data 1.____changes 2.________the percentage 3. ______women in tertiary education in nine selected countries over an 8-year period from 1998 to 2005. In general, participation 4._____this level of education increased in all countries with the notable exception of Bulgaria which decreased. More specifically, despite having the overall highest percentage in 1998 5._______60.9% of women studying, figures in Bulgaria decreased consistently over this period ending 6.____the second to last position with 52.1%. Although the percentage of students rose in Japan, from 44.6% to 45.9% over the 8 years, they remained in 9th position. Figures in Sweden remained 7.______59.6% over 3-consecutive years from 2003 to 2005 which was 3.4% higher than 8.____the start of this survey. The only country to experience a continued growth was the UK where percentages grew 9.____52.7% to 57.2%; a climb of 4.5% and the second-largest overall increase. This is almost certainly the result of greater competition leading to the need for more qualified employees.
Exercise 4B
The general statement used above is a typical trend sentence. It would also be possible to use a general statement main idea like the one shown below:
In general, a greater percentage of women in Iceland were in tertiary education than in any another country whereas the lowest involvement in this level of education was in Japan.
Why could vou not write: …. more women in celand were in tertiary education
Also, what do you think of the very last sentence in this main body? Can we add our own opinions?
Show Answers
Exercise 4A
- on
- in
- of
- in / at / for
- with
- in
- at
- at
- from
Exercise 4B
We cannot write about "more women" or "fewer women" from any of the countries because we only know the percentage of women in tertiary education.
We do not know how many women there are and so we can only talk about higher or lower percentages. The population in each county will be different, and so, for example, 57.2% in 2005 for the US and UK will not be the same number of women
NOTE: You cannot add your opinions, or interpretation of why you think something happened, to a Task 1 essay.
The only exception is when you are writing about a map that shows several possible locations for a new building. For this, you have to discuss the advantages and disadvantages of each potential site
Exercise 5
Look at the table taken from a survey conducted in the UK in 2009 about household chores and then try to complete the essay below it by adding prepositions.
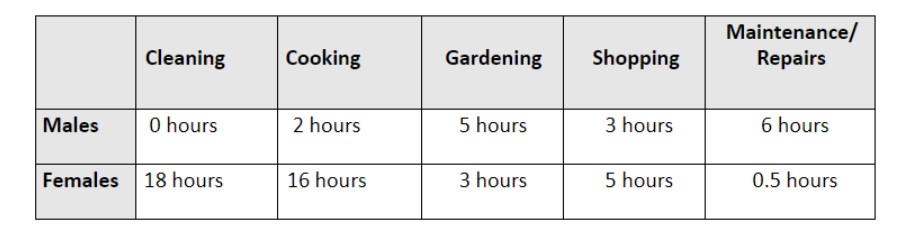
Understanding how to use prepositions correctly will add greatly to your ability to get a higher grade in your test. Think of prepositions not as separate words, that you always need to decide where to put, but as being linked to different phrases. This saves time and also makes your grammar more accurate.The table compares and contrasts data 1____the differences 2____the amount 3____time spent 4____both sexes, 5______an average week 6___the United Kingdom, 7_____five different household activities 8_____2009. In general, men spent most 9____their time maintaining or repairing things whereas women spent the majority of their time cleaning. Maintenance and repairs (6 hours) was the most time-consuming household task 10_____men whereas it was the least common activity 11___women; spending only 30 minutes per week 12____this. Similarly, women spent the most amount of time 13____cleaning (18 hours) but men spent none of their time. Men. 14____average spent five hours gardening which was just 15 _______ double the time spent 16____the same activity 17____women (3 hours). By contrast, the amount of time women spent 18____cooking (16 hours) was exactly eight times more than the time spent 19_____men 20_____the kitchen. One further point to note is that women spent the same amount 21____time shopping as men did gardening (5 hours)
Show Answers
- ON
- 2.IN
- 0F
- BY
- IN
- IN
- ON
- IN
- OF
- FOR
- FOR
- ON
- ON
- ON
- UNDER
- ON
- BY
- ON
- BY
- IN
- OF
Exercise 1
You should spend about 20 minutes on this task.
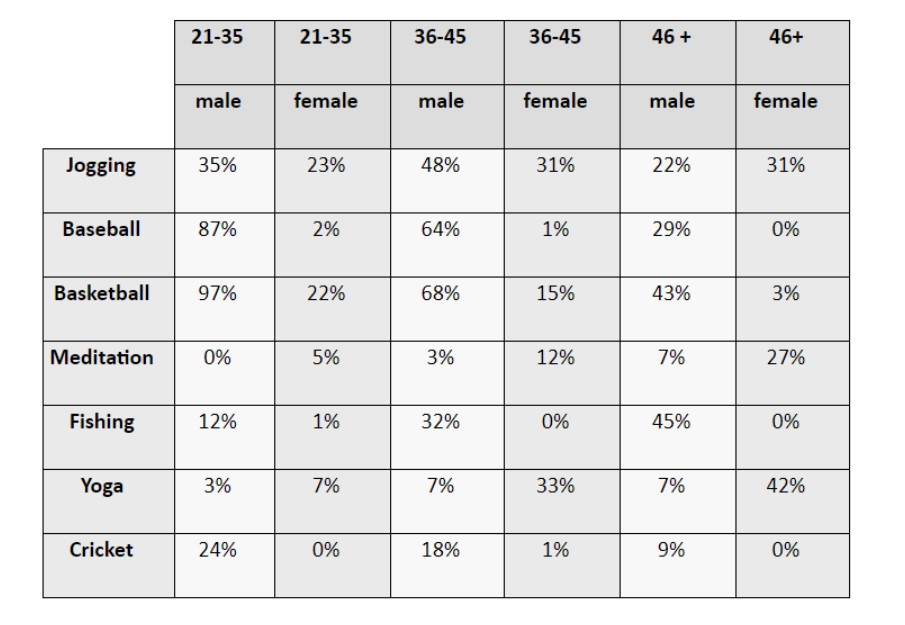
The diagram below shows various leisure time activities enjoyed by males and females of different age groups.
Summarise the information by selecting and reporting the main features, and make comparisons where relevant.
Write at least 150 words.
Show Answers
The tabular data compares gender and age-wise preferences from seven different leisure time activities. Overall, a higher percentage of men participated in these activities apart from meditation and yoga which were favored by women.
The least preferred activity by males in the 36-45 age group was meditation with 3% participation whereas 12% of females participated in this activity. The major increment in the percentage of female participants in yoga was from a minor 7% in the youngest to 42% in the oldest age group. For the opposite gender, however, there was a striking change observed in the participation number for fishing from 12% youngsters to 45% of the older group. No difference was seen in figures for jogging at 31% for women and in yoga at 7% for men in the two older age groups.
Interestingly, the biggest variation in participation was for baseball, with 87% male while their counterparts had only 2% in the youngest age group, and the gap was maintained in the other age groups.
(171 words)
Exercise 2
You should spend about 20 minutes on this task.
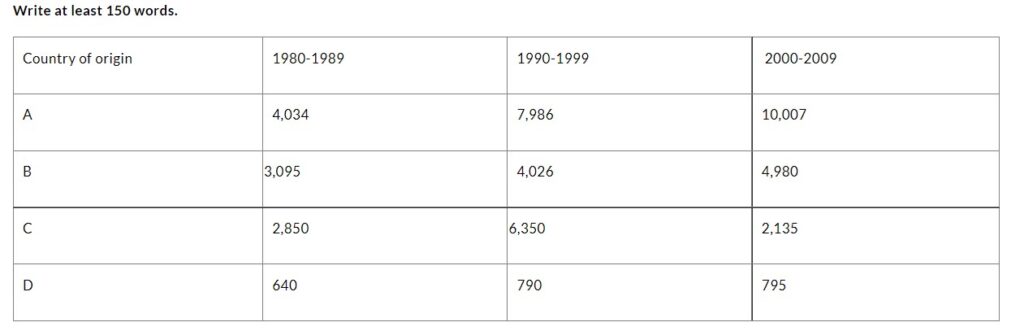
The table below shows the number of overseas students (in thousands) from four different countries to a specific reputed university.
Summarise the information by selecting and reporting the main features, and make comparisons where relevant.
Show Answers
The statistical data compares the inflow of international students from four countries to a famous university in three decades.
Overall, the country C students reversed the inflow proportion in the final year.
It is evident from the table that the enrolments from country A had been increasing and had topped the charts throughout the period. The figures almost doubled in the first period and rose further to around 2000 to cross ten thousand by 2010. The other countries B and C initially had nearly similar numbers at 3,095 and 2,850 respectively and country D bottomed the charts sending 640 students.
After that, a systematic growth in enrolments from country B was noticed from 3,095 to 4,980 in thirty years. The same trend was seen for country D, which sent 795 in the final year. However, a significant entree growth was recorded by the country C students in the second decade, where the number exceeded twofold before declining to less than the initial amount.
(words 166)
- Skill building exercise 1
- Exercise 1
- Exercise 2
Skill Building Exercise 1
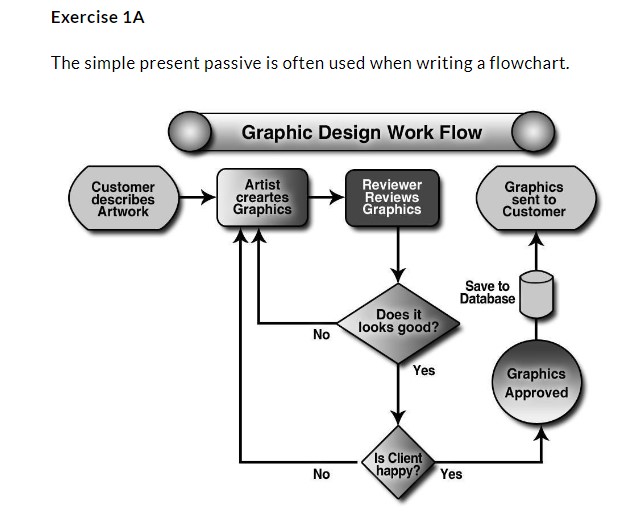
Look at the text below written about the flow chart given above and underline all of the passive verbs. Has the passive been used for all of the verbs? Is the simple present passive the only passive form used here?
The illustration details the various stages involved in the creation of graphics from a customer’s description of his artwork.
First of all, the customer talks to the graphic artist about his artwork and describes what he wants. The artist then creates the graphics using the information that he has been given. The finished graphics are subsequently reviewed by a reviewer to see how good they are. After this, if it is felt that they do not look very good, they go back to the graphic artist who redesigns them. If, however, the graphics pass the standards set by the company, they are passed to the client who will either approve or reject them. If they are considered unacceptable, they go back to the designer. However, if the graphics are to the client’s liking, they will be approved and saved in their database. Once the graphics have been stored in the company’s database, they are sent to the customer.
Exercise 1B
Complete the sentences by turning the verbs in brackets into the simple present passive. Be careful because not all verbs follow the formula: is/are + verb/ed.
- The corn, once fully mature,____(harvest)
- The water__(boil) and then the tea__(add)
- The sieve__(shake) in order to remove the dirt.
- The trees___(cut) before_____(transport) to the wood mill.
- Subsequently, an e-mail is____(write) and then sent to the company.
Show Answers
Exercise 1A
The illustration details the various stages involved in the creation of graphics from a customer's description of his artwork.
First of all, the customer talks to the graphic artist about his artwork and describes what he wants. The artist then creates the graphics using the information that he has been given. The finished graphics are subsequently reviewed by a reviewer to see how good they are. After this, if it is felt that they do not look very good, they go back to the graphic artist who redesigns them. If, however, the graphics pass the standards set by the company, they are passed to the client who will either approve or reject them. If they are considered unacceptable, they go back to the designer. However, if the graphics are to the client's liking, they will be approved and saved in their database. Once the graphics have been stored in the company's database, they are sent to the customer.
Exercise 1B
- is harvested
- is boiled, is added
- is shaken
- are cut, they are transported
- is written
Exercise 1
You should spend about 20 minutes on this task.
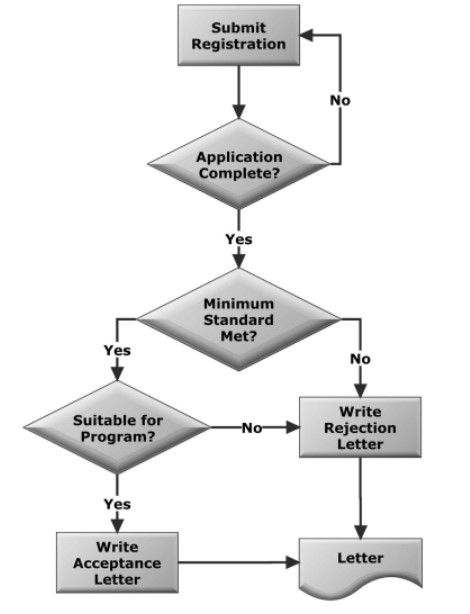
The chart below shows how an application letter is either accepted or rejected at a college.
Summarise the information by selecting and reporting the main features, and make comparisons where relevant.
Write at least 150 words.
Show Answers
The illustration provides details of the various stages involved in the registration of a student into a faculty. Overall, this is a standard procedure for registration in college after the form is submitted.
Initially, a prospective student submits his or her registration form to the college. The form is assessed in stages to prove student eligibility. The incorrect form is returned to the student for the amendment. The acknowledged and complete registration form is passed on to the registrar to determine whether or not the student meets the minimum standards. Failure to meet these standards results in writing a rejection letter to be sent to the student. If the candidate meets the minimum standard, the faculty advisor decides if the applicant is suitable for the program. An affirmative results in an acceptance letter being written and then sent to the student. If considered unacceptable, the advisor writes a rejection letter which is forwarded.
Skill Building Exercise 2
You should spend about 20 minutes on this task.
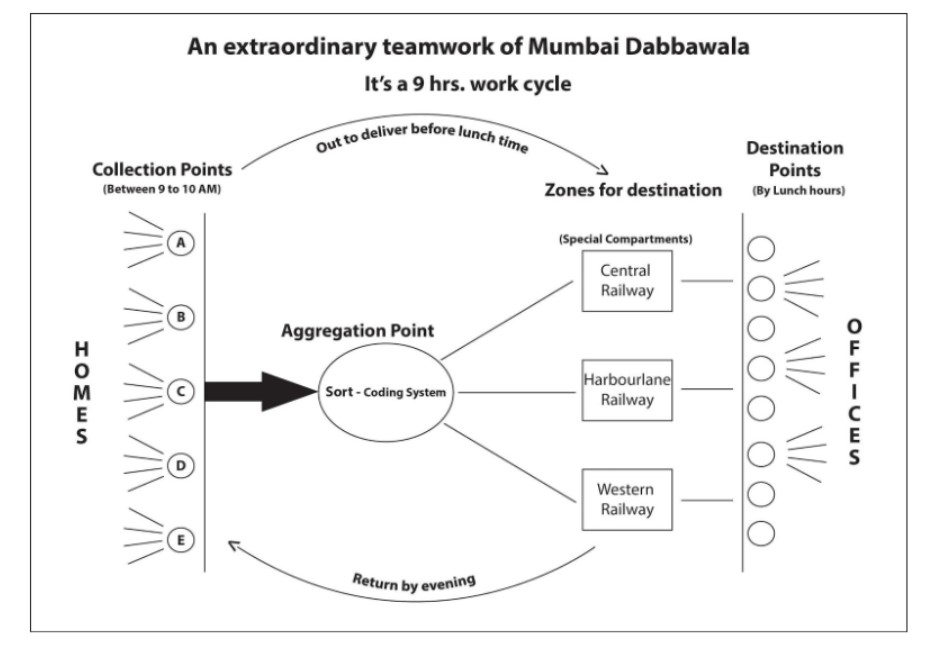
The flowchart describes the daily cycle of the Mumbai Dabbawala tiffin supply.
Summarise the information by selecting and reporting the main features, and make comparisons where relevant.
Write at least 150 words.
Show Answers
The diagram illustrates the nine-hour work cycle of Mumbai Dabbawala to carry tiffins to various destinations through three railway routes. Overall, outstanding teamwork is carried out by Mumbai Dabbawala to cater the lunch demand
Every morning the tiffins are collected from homes or other collection points. The team completes the collection in one hour to assemble at the aggregation point. Here, the tiffins are sorted out with the help of a coding system for delivery to different areas. Tiffins are then carried zone-wise in luggage compartments via three railway routes, namely Central Railway, Harbourlane Railway and Western Railway.
The assigned tiffins are unloaded at the railway stations. Once again the tiffins are sorted with efficient teamwork required at this stage. Assigned Dabbawalas deliver the tiffins to the specific business building. The tiffins reach before lunchtime. The same procedure is followed to send the empty tiffins from offices to the houses by evening. Excellent teamwork is required for time management at every step.
(162 words)
- Skill building exercise 1
- Exercise 1
- Exercise 2
Exercise 1
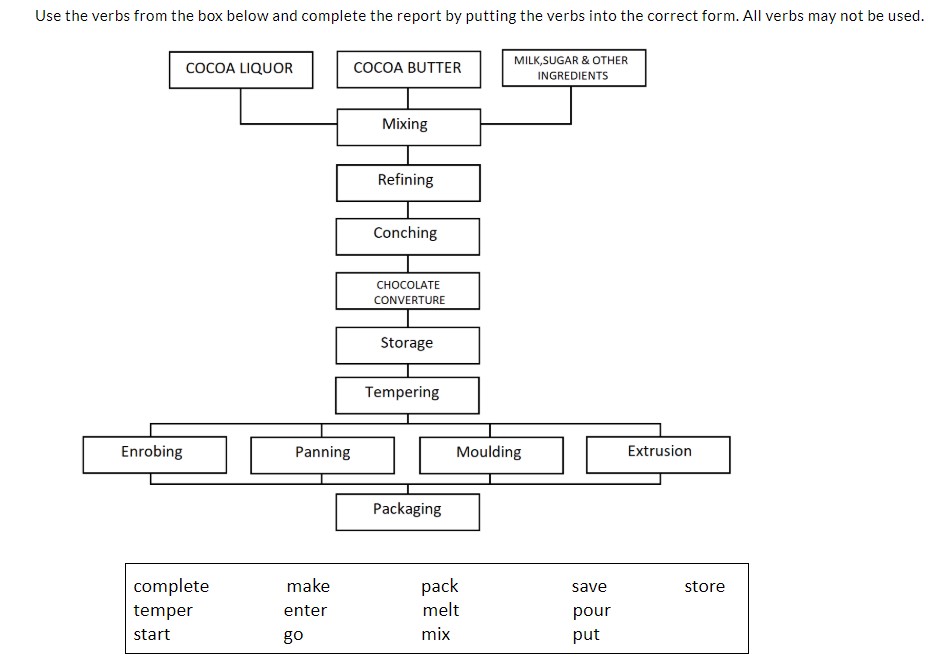
The manufacturing of chocolate 1.______with the 2.______of cocoa liquor, cocoa butter, milk, sugar and a range of other ingredients. After these have been thoroughly blended together the mixture 3._____the refining stage of production. Once this particular stage in the manufacturing process 4.____, it is then followed by conching a process that results in a mixture called the chocolate converture. The converture 5._____for a period of time before it 6.__ Subsequently, four different and penultimate processes are carried out simultaneously. These are enrobing, panning, moulding and extrusion which then lead to the final stage of this process where the chocolate 7.______into packaging.The illustration highlights the stages involved in the production of chocolate from four main ingredients.
Show Answers
Exercise 1
- starts
- mixing
- enters
- has been completed/ is completed
- has to be stored/ is stored
- is tempered
- is put
WRITING TASK 1
You should spend about 20 minutes on this task.
The diagram below shows how hydrogen can be made using simple laboratory equipment.
Summarise the information by selecting and reporting the main features, and make comparisons where relevant.
Write at least 150 words.

Show Answers
The stepwise process explains the preparation of hydrogen gas in the laboratory. Overall, this is a basic laboratory experiment to get hydrogen with measured components and a systematic arrangement of apparatus.
Initially, approximately 5ml. of tap water and 1gm. of zinc are put into a 50ml. graduated glass cylinder. Then, the top of the glass cylinder is fitted with a cork and a thistle funnel along with a glass pipe inserted into it. The slass pipe connects the cylinder with a glass dish. Sufficient water is placed in the dish to cover the top of the pipe which is then covered with a water-filled test tube.
Further, 5 ml of hydrochloric acid is added to the funnel. Once the hydrochloric acid comes into contact with the water, an immediate chemical reaction starts. Hydrogen gas is released and starts to travel down the pipe and gets collected into the test tube. The water is displaced in the test tube with pure hydrogen gas.
(162 words)
Writing Task 1
You should spend about 20 minutes on this task.
The diagram shows how solar energy converts into environment-friendly alternative energy.
Summarise the information by selecting and reporting the main features, and make comparisons where relevant.
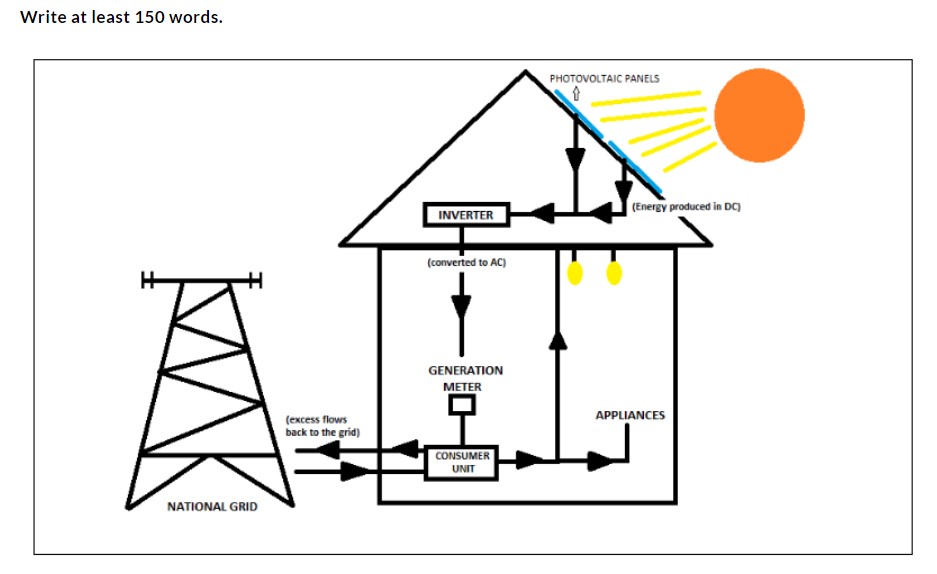
Show Answers
The pictorial illustration shows how solar power is produced by collecting and converting it into electricity with the help of photovoltaic panels. Overall, alternative energy production is eco-friendly as it uses a natural, renewable resource and there is no release of by-products.
The solar panels absorb energy from the sun and produce energy in DC with the help of photovoltaic cells. The produced DC electricity cannot operate the home power system, so an inverter is connected to convert the DC to AC electricity. The AC electricity flows from the inverter through wires into a generation meter. With the help of this meter, the electricity produced is measured according to which the consumer unit distributes electricity as per the power requirement, and the excess solar electricity is put back into the grid. Finally, the generated electricity powers all the appliances. If the panels do not create sufficient energy to meet the requirement the power from the grid fulfils the demand which is already connected to provide electricity.
(167 words)
- Skill building exercise 1
- Skill building exercise 2
- Exercise 1
- Exercise 2
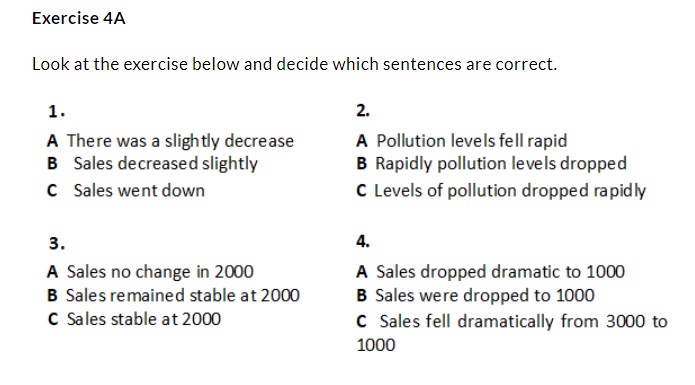
Exercise 4B
Now complete the six sentences below by using some of the words in brackets.
- ______sales____in New York from USS165,000 in 2003 to US$132,000 in 2010, figures_____higher than all of the other five cities. (felled /fell / falling /interestingly / stay / remained / despite)
- The percentage of women majoring in science subjects_____from 7% to 8% over this period of time. (increase / increased / slight / slightly/ decreased / significantly)
- Levels of pollution_____from 1200 metric tons in 2007 to 3000 metric tons in 2010; a climb of 1800 metric tons. (increase / rose /dramatic / dramatically / climb / slight)
- The number of accidents in school playgrounds_____by 15% over the five years; __________,______ from 27% to 12%. (rose / fell / decrease / decreasing / increase / substantial / substantially)
- Traveling by bus also________with the total mileage _______from 540,000 miles in 2001 to 235,000 miles 7 years later. (drop / dropped / fall / falling / steady / went down)
- Generally speaking, salaries were______in Europe than in Asia. (significant / significantly / high / higher)
Show Answers
Exercise 4A
- B
- C
- B
- C
Exercise 4B
- Despite sales falling in New York from US$ 165,000 in 2003 to US$132,000, figures remained higher than all of the other five cities.
- The percentage of women majoring in science subjects increased slightly from 7% to 8% over this period.
- Levels of pollution rose dramatically from 1200 metric tons in 2007 to 3000 metric tons in 2010, a climb of 1800 metric tons.
- The number of accidents in school playgrounds fell by 15% over the five years, decreasing substantially from 27% to 12%.
- Traveling by bus also dropped with the total mileage falling from 540,000 miles in 2001 to 235,000 miles 7 years later.
- Generally speaking, salaries were significantly higher in Europe than in Asia
Exercise 1
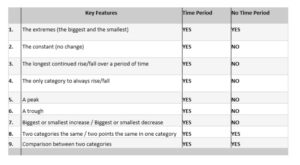
Here you will begin to look at some of the main features of a diagram that you can look for when writing the main body. What you look for, however, will depend on whether the diagram has the time or not. A diagram with a period will focus more on what changes but a diagram with no period will focus more on comparisons and contrasts.
Exercise 8A
Look at the table below and complete the last two columns indicating what you can look for in each type of diagram. Write YES if you can look for this particular feature and NO if you cannot.
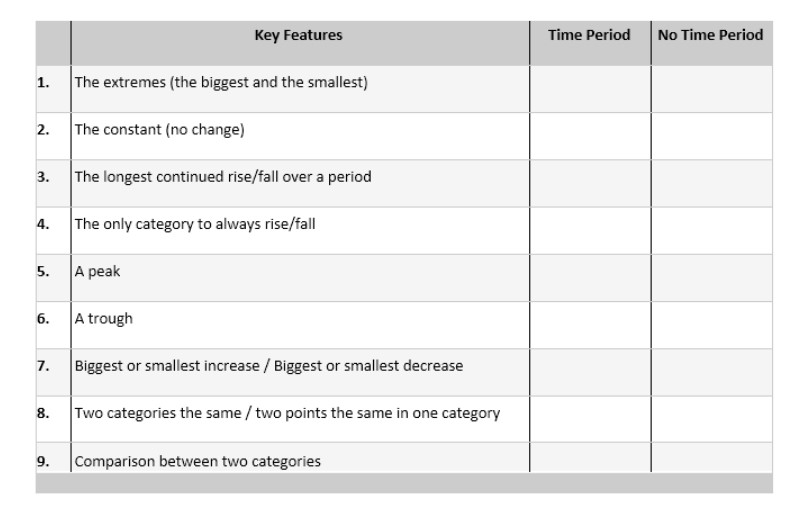
Exercise 8B
Now look at the sentences below and match them to the correct key feature above.
For example, A matches with key feature number 5.
Show Answers
Exercise 8B
- E
- G
- 1
- B
- A
- F
- H
- C
- D
WRITING TASK 1
You should spend about 20 minutes on this task.
The diagram below shows information on oil exports from Libya in 2011.
Summarise the information by selecting and reporting the main features, and make comparisons where relevant.
Write at least 150 words.

Show Answers
The picture illustrates the share of oil exports from Libya to different parts of the world in 2011. Overall, the biggest percentage of oil exported is received by Italy.
It is seen that Libya exports 80% of the crude oil produced every day. To begin with, Italy has the lion's share of oil from Libya with 32%. Germany receives the second-highest share of oil at 14%. While the same percentage is shared by nine other EU countries. Oil exports to France constitute 10% of Libya.
China also receives 10% which is relatively higher than the exports to other Asian countries (3%). Apart from this, roughly 9% of the oil import is done by Spain that year. On the other hand, The United States imported relatively less share of crude oil from Libya in 2011, which is barely at 5%, just 1% lesser than Spain. Finally, Brazil also receives a minor share of Libya's oil export.
(Words 161)
Writing Task 1
You should spend about 20 minutes on this task.
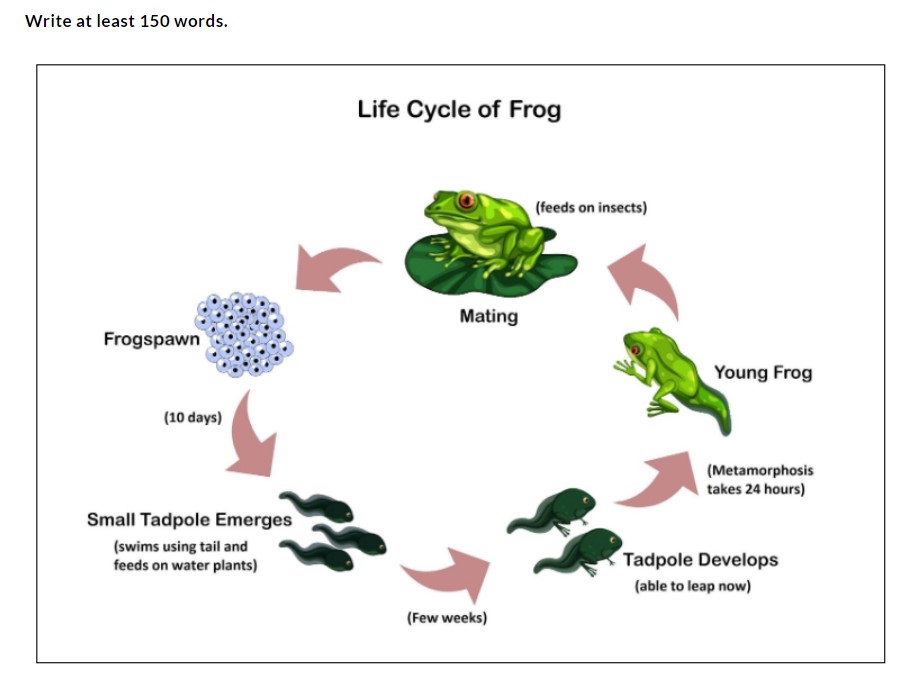
The diagram below shows the life cycle of a frog.
Summarise the information by selecting and reporting the main features, and make comparisons where relevant.
Show Answers
The diagram illustrates the life cycle of a frog. Overall the process shows how an adult frog is developed from the tiny eggs.
The adult male and female frogs undergo the mating process and as a result, female frog lays multiple eggs, known as frogspawn, at one time. The eggs hatch into tiny tadpoles after 10 days. These tadpoles have no legs. After some days the tadpole starts to develop and also starts to grow two hind legs. The tadpole swims, eat and grows for several weeks. Now it can leap around instead of only swimming. Although the tadpole is starting to look a little more like a frog, it still has a very long tail. It grows two front legs and its long tail becomes shorter and shorter as it grows. Metamorphosis, which is the rapid transformation of the frog from the tadpole stage to adult stage, takes 24 hours. The tadpole is then a young frog. The frog's tail eventually disappears completely and it starts to eat insects instead of plants in the water.
(176 words)
- Skill building exercise 1
- Exercise 1
- Exercise 2
Exercise 1
Look at the list of verbs below and decide which verb in Table A goes with which object in Table B. It might be possible to use some of the verbs with more than one item.
Table A
demolish | construct | convert | raze |
fell | establish | develop | log |
Knock down | close | build | widen |
open | Chop down | erect | replace |
Table B
a building | a business | a road | a forest |
Exercise 2
Now turn the verbs above into their participle form.
*In the actual response, the tense must be appropriate to the mentioned years) in the diagram.
verb | Past Participle |
demolish | |
construct | |
convert | |
raze | |
fell | |
establish | |
develop | |
log | |
knock down | |
close | |
build | |
widen | |
open | |
chop down | |
erect | |
replace |
Show Answers
Exercise 1
a building | a business | a road | a forest |
demolish | establish | construct | fell |
construct | develop | convert | log |
convert | close | establish | chop down |
raze | build | close | |
knock down | open | open | |
build | replace | widen | |
erect |
Exercise 2
verb | Past Participle |
demolish | demolished |
construct | constructed |
convert | converted |
raze | razed |
fell | felled |
establish | established |
develop | developed |
log | logged |
knock down | knocked down |
close | closed |
build | built |
widen | widened |
open | opened |
chop down | chopped down |
erect | erected |
replace | replaced |
WRITING TASK 1
You should spend about 20 minutes on this task.
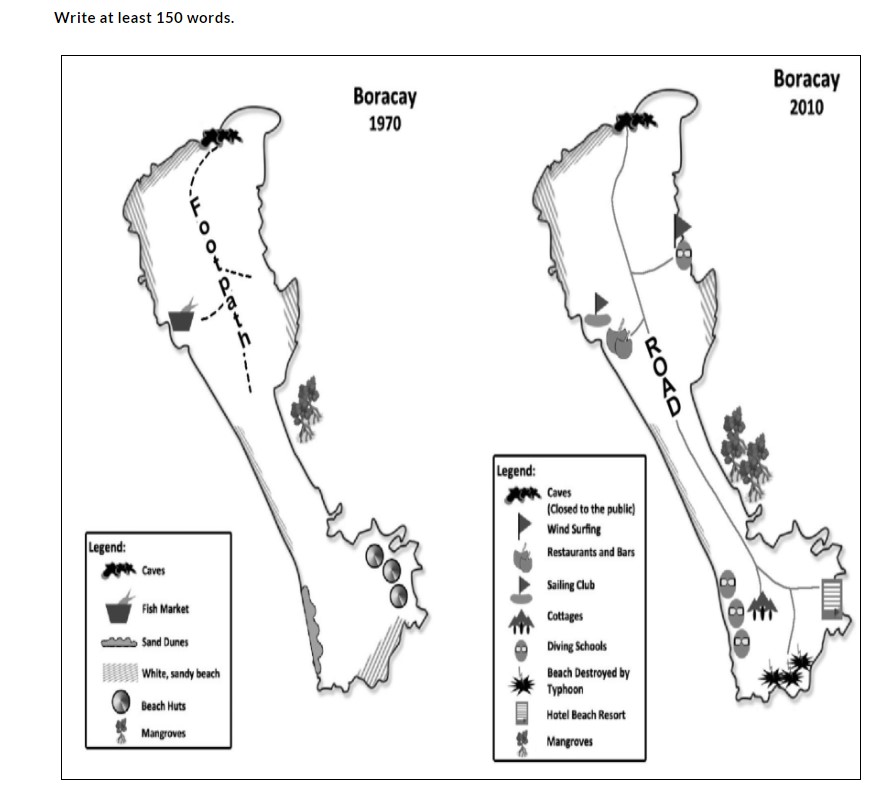
The diagrams below show how Boracay Island has grown as a tourist destination from 1970 to 2010.
Summarise the information by selecting and reporting the main features, and make comparisons where relevant.
Write at least 150 words.
Show Answers
The layouts highlight the evolution of Boracay island, from a small, undeveloped island to a tourist-focused destination over a 40-year period. Overall. it can be seen that the changes have replaced native fishing business with tourism.
The caves on the northern coast of the island were closed to the public by 2010, and the fish market on the west coast was closed to make way for restaurants, bars and a sailing club for the tourists. Further, to facilitate tourists, windsurfing and diving schools had been developed on the other end of the island which was once deserted.
Similarly, the beach huts on the southern part of the island had been replaced with a hotel beach resort. The white. sandy beach there was destroyed by a typhoon, and the dunes were now home to diving schools and cottages. The original footpath, leading from the caves has been turned into a road that runs the length of the island and connects all of the main tourist spots. While no change had been made to the mangroves which have now increased in number.
(180 words)
Writing Task 1
You should spend about 20 minutes on this task.
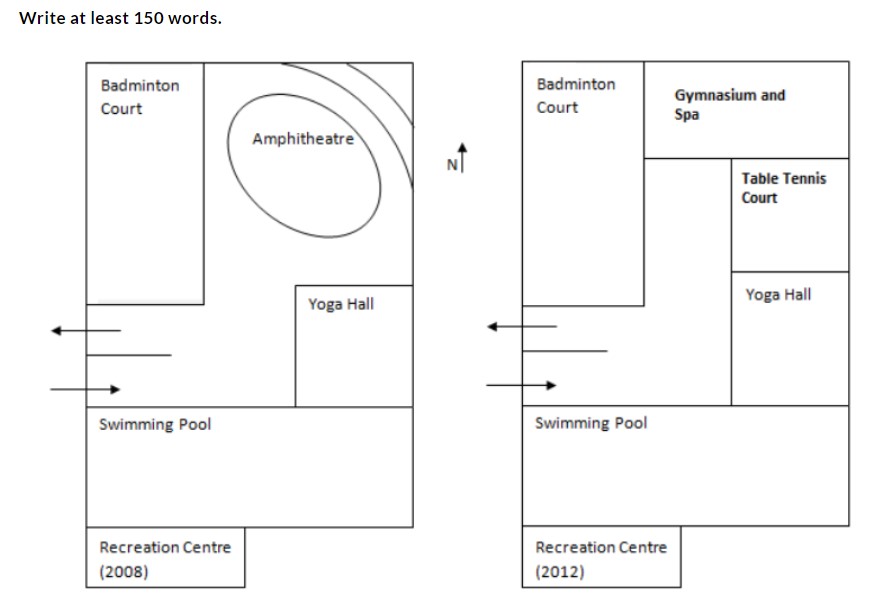
The maps below give information about a recreation centre in 2008 and 2012.
Summarize the information by selecting and reporting the main features and make comparisons where relevant.
Show Answers
The layouts show the transformation of a recreational centre between the years 2008 to 2012. Overall, it can be seen from the maps that the design of the recreation centre underwent few changes over the period of four years. Largely, the major change was that the amphitheatre was removed from the plan after four years.
In the year 2008, there was a swimming pool located in the southern part which remained the same in 2012. Similarly, the badminton court which was located in the northwest corner remained untouched. The amphitheatre was completely removed in the new plan and in its place a gymnasium and spa was opened in the northeast corner, with another addition of a table tennis court to the south of it, adjoining to the already existing yoga hall. The entry and exit gates which were located between the badminton court and swimming pool, towards the western side of the recreation centre, were still the same in the year 2012.
(162 words)
- Understanding the task
- Skill Building Exercises
- Agree Disagree
- Advantages - Disadvantages
- Problem and Solution
- Discussion (Discuss both views)
- Two Part Question
- Compare and Contrast
- Understanding task
- Understanding Question Types
- Developing Ideas
- Format of Essay Writing
What is IELTS Writing Task 2?
In the IELTS Writing Task 2, you are given a topic that consists of a stated fact or someone’s opinion and a question. You have to write an essay addressing this question based on the given topic, in a minimum of 250 words in around 40 minutes’ time.
You need to take a clear stand/position regarding the topic and develop appropriate ideas which support your position. You have to do this using relevant explanations and examples.
A typical Task 2 question looks like this:
You should spend about 40 minutes on this task.
Write about the following topic:
Obesity is a major problem prevailed among modern children. What are its causes and what solution can be offered? |
Give reasons for your answer and include any relevant examples from your knowledge or experience.
Write at least 250 words.
It informs you about the time you should devote to this task, the minimum number of words required to be written and most importantly the topic and the question you are needed to answer.
Understanding the question
Once you have read the instructions, you have to read and understand the question asked of you. It is easy to recognise the question if you are able to understand the relation between the stated fact/opinion and the question. You need to know that you have to answer what is being asked in the question and not write any information or show your knowledge of the topic. You don’t have to cover every aspect of the topic but only answer for the specified area asked in the question.
Question types for Writing Task 2
There are in general 5 essay question types asked in IELTS.
- Opinion (Agree or Disagree)
- Advantages and Disadvantages
- Problem and Solution
- Discussion (Discuss both views)
- Two-part Question
It is important to identify the question type given in the task in order to develop relevant ideas.
Before you begin writing your answer, it is important that you brainstorm the ideas that you are going to include in the essay and also to think of the explanation and examples that you will use to support your ideas. If you don’t plan, there are chances that your ideas will be disorganised and you will lose marks because of it.
To do this, first, decide what stand you will take. Once you have decided on the stand think of the reasons why you hold that opinion and note them. Also, think of how you will explain these ideas. It is important that you do so otherwise your essay may have a lot of ideas but if those ideas are not supported with a relevant explanation then it will not be a well-developed essay.
Also, planning your answer before writing ensures that you are writing in support of your position and that you do not digress from it in between the essay.
It helps you to hold your essay together.
After brainstorming on all the ideas that you are going to include in your essay, you should organise these ideas grouping them in different paragraphs on the basis of which idea is most important and should come first and which idea should follow thereafter. Once the planning and organising is done you can write your answer in a logical and coherent manner.
An essay consists of an introduction, the body paragraphs and a conclusion. It is important to write your answer using the appropriate format or you will lose marks.
Writing introduction
The introduction of an essay informs the reader about the topic of the essay. It gives the reader an idea about what they are going to read. In IELTS too you need to write an introduction in your essay.
This introduction consists of two statements. The first is a general statement which provides some basic idea about the essay topic. For writing the general statement you can simply paraphrase the question statement or write some other statement of your own which introduces the topic. The second statement which is to be written in the introduction is more important. It is called the Thesis statement.
Thesis statement
One most important element of an essay in IELTS Writing Task 2 is the author’s thesis statement. This statement shows the stand of the writer. You are the writer of the essay and what position vou take should be clearly written in vour essav. The examiner will look for a statement in either your introduction or the conclusion paragraph which directly states vour position
There are three positions that you can take on any topic; either you can agree with an opinion, or you can disagree. The third way is you can sit on the fence. What sitting on the fence means is that you don’t strongly support any one side, instead, you are neutral and can give ideas supporting both the sides.
Your writing is not judged on what stand you take but on how well you support it. It is suggested that you take one specific stand rather then being neutral as it is difficult to be able to write impartially about both sides. Your answer may get inclined towards one side which will make your thesis statement untrue.
Body Paragraphs
The body paragraphs are where you write your main ideas supporting the stand that you have taken about the subject. The ideas need to be logically arranged in different paragraphs with relevant explanation and examples. Do not write very long paragraphs instead divide the ideas into two-three short paragraphs.
Conclusion
When writing an essay it is important to conclude your answer. The conclusion is just a restatement of your thesis statement. You need to paraphrase the thesis statement that you wrote in the introduction as rewriting the same will not fetch you any marks. The conclusion should not include any new idea, all the ideas should be discussed in the body paragraphs only.
- Identifying The Type Of Essay
- Match The Statements
- CORSSWORDS
Recognizing the topic is not so difficult but knowing how to approach the essay can be more complicated. Luckily, there are only three main essay types, but it is essential to become familiar with all three and the different ways you are told what to do. Be careful if the wrong essay is written a lower grade will automatically be given.
The three types are:
- Agree or disagree with a stated opinion
- Present the advantages and disadvantages of a stated situation /issue
- Provide possible effects and solutions to a particular problem
Exercise
Look at some typical Task 2 instructions seen in the IELTS test and decide which essay type they are: A, B or C.
- What do you think are the effects of global warming? What solutions can you suggest?
- Many are of the opinion that television is an important medium for imparting useful information. Others, however, disagree and think that more control over what young people see should be imposed. To what extent do you agree or disagree?
- What are the advantages and disadvantages of having a gap year?
Notice that some instructions are inferred. That is to say, if the Task 2 statement is an opinion, but no instructions follow, the essay type is Agree/Disagree.
For instance:
“Many Western countries are facing a serious decrease in population levels which will seriously affect their economy in the future. Governments should, therefore, offer incentives to encourage couples to have more children.”
This type of essay is sometimes mistaken for a problem/solution essay, but the difference here is that one solution to declining population figures has already been given as an opinion. This opinion becomes the focus of the essay, and you must agree or disagree with it. You are not asked to offer alternative solutions.
It is better to focus on one side of the argument rather than be somewhere in the middle. Even experienced writers can end up arguing against themselves if they decide to sit on the fence. Therefore, 100% agree or 100% disagree and confirm this in the introduction by stating that, for instance, I completely agree that
Answer
- C
- A
- B
MATCH WITH THE TYPES OF PARAGRAPH
Match the sample sentences below with the introduction, main body, or conclusion, and decide which type of essay they are probably from. Write:
A…. if it is Agree / Disagree
B …. if it is Advantage / Disadvantage
C…. if it is a Problem / Solution
- As a result, more attention has been paid to the benefits and drawbacks of developing zoos as a means to protect them
- In conclusion, although there are obvious drawbacks to studyins overseas, there are more benefits.
- The government should begin to develop better methods of controlling the damage brought about by large increases in tourism.
- Finally, the chance to learn social skills with both sexes also helps strengthen my conviction that mixed schools are the preferred environment for students.
- Despite overwhelming evidence to the contrary, many people still feel that capital punishment is an effective way of reducing the number of offenders.
How many sentences do you think you need to write a 250-word essay?
The exact structure of your essay will depend on the instructions given to you. These instructions must be followed closely, or you risk ending with a lower grade than you deserve. Typically you will read:
Agree – Disagree Essay Do you agree or disagree? / Discuss both sides and then give your opinion.
Advantage – Disadvantage Essay Discuss the advantages and disadvantages of this and then give your own opinion./ Do you think the advantages outweigh the disadvantages?
Problem – Solution Essay What are the problems associated with this, and what are some of the solutions?
Answer
- B – INTRODUCTION
- B – CONCLUSION
- C – MAIN BODY OR A – INTRODUCTION
- A – CONCLUSION
- A – INTRODUCTION
- You should need approximately 12 to 15 sentences for a 250-word essay.
Discover some of the most common topics used in the Task 2 writing test by completing the crossword. Use the definitions of each word at the bottom of this page to help. You can use a dictionary to help.
ACROSS
- The community in which a person lives.
- The characteristics of a group of people that makes them unique.
- Your surroundings, especially natural surroundings.
- The process of learning different things.
- The study of the environment.
DOWN
- The state of a living body.
- The practical application of knowledge.
- The economic activity related to serving people when they travel.
- When the local or national ways of doing things become international.
Answer
ACROSS
- society
- culture
- environment
- education
- ecology
DOWN
- health
- technology
- tourism
- globalization
- Essay 1
- Essay 2
The youth should not be given more freedom because they are not mature enough to use their liberty desirably. To what extent do you agree with this statement?
Everybody loves freedom, and the youth is probably more intense than the grey population. However, many people counter-argue and try to check it. I firmly believe that depriving someone of their freedom is against democracy and is inhuman
The first argument to my inclination is, a democratic nation has bestowed the right of freedom to every citizen. The government that divests its people of individual liberty is not democratic but autocratic, and the suppression exercised by government invariably leads to rebellion and insurgency. Thus, oppression will breed revolt and subversion of the government.
Furthermore, the youth will not mature until and unless they are given freedom. When a person can learn from his errors will bring maturity to him. Also, when the youth are simply dictated how they should behave and guided, they do not grow the capability of differentiating the fine line between right and wrong
On the other hand, I also understand some people’s misgivings about unlimited freedom the youth are enjoying which sometimes harms the people and the society. For example, young people have a right to stay up till late at night, but they have no right to play loud, raucous music at midnight and disturb others. I believe that, if the freedom given to the youth is unchecked and impinges on the lives of other people. it must be restricted.
In short, the youth should be given freedom to live, to err and to learn but they should be sensitive towards other people’s rights also.
(250 words)
Grey population (n): elderly people
Bestow (v): to give something to somebody, especially to show how much they are respected
Autocratic (adj): governed by one ruler who has complete power
Insurgency (n): an attempt to take control of a country by force
Subvert (v): to try to destroy the authority of a system by attacking it secretly
Subversion (n): destroying the authority of a system by attacking it secretly
Dictate (v): to tell somebody what to do
Misgiving (n): the feeling of doubt or anxiety about what might happen or whether or
not something is a right thing to do
Raucous (adj: sounding loud and rough
Impinge (V): to have a noticeable effect on something, especially a bad one [synonym: encroach]
Err (v): to make an error
Teaching history in schools is not as useful as teaching other subjects, and therefore students should be allowed a choice not to study history. How far do you agree?
Every subject has its significance, and therefore it is not justifiable to privilege one subject over others. Similarly, studying history equips students with specific aptitude and attitude that cannot be developed by studying other subjects. Therefore, I do not agree that teaching history is unnecessary.
First, the study of history is interesting as it includes many stories and historical events which provide the basic knowledge of art, culture and history. So, the cultural awareness is inculcated in students from the early years of schooling and further gives them an explanation of the present scenario which in turn enables to predict future possibilities. A person who is ignorant of native history will feel like an alien in his homeland. This further will hamper his ability to socialise in society. For example, a student born in a country where various faiths, cults, cultures and languages coexist, will understand better his country’s diversity of cultures if he studies the history of his country.
Secondly, it is a grave mistake if we perceive that the sole purpose of education is to churn out only technocrats, scientists and doctors. The broader scope of education is to make knowledgeable, and responsible citizens of the nation, for which study of the country’s past is inevitable to take lessons from the past experiences. We should allow the students to opt for the specialisation to learn the advanced level of history by choice
To conclude, in my opinion, the teaching of essential history in schools is indispensable, but students must be given the freedom to choose their specialisation.
(260 words)
Inculcate (v): to make somebody learn and remember moral principles ori deas
Hamper (v): to prevent somebody from easily achieving something or doing something
Cult (n): a system of religious beliefs and practices
Coexist (v): to exist together harmoniously
Churn out (phrasal verb): to produce something very quickly and in large amounts
Inevitable (adj) : that cannot be avoided [synonym: indispensable]
- Essay 1
- Essay 2
Some people believe that the disadvantages of advertisements easily outweigh the advantages. To what extent do you agree with this opinion?
In the age of information technology, the competition is becoming tougher day by day in every field; it has become virtually impossible to run any business without advertising about it. However, I agree to a large extent that the merits of advertisements cannot outweigh its demerits.
The first argument can be, it compels a person to buy a particular product because of repetitive advertisements. Companies bombard slogans into the consumer’s mind through media and hoardings, which leads people into buying that product not because of its quality but because of their push-marketing strategies. One more side-effect of advertisement is that many a time alluring offers prove to be just marketing gimmicks used by rapacious corporations to deceive customers and consumers. For example, during festivals, most of the companies launch some discount schemes, but before giving the discount, they generally hike prices of things, which disappoints people.
Another less welcoming side of advertisement is that it can make shopaholic people more obsessed with unnecessary shopping. The big hoardings sight of advertising sales of jewellery, watches and smartphones which pester shopaholic people with their frequent shopping sprees, though their possessions are brimming with a lot of treasure trove. Nonetheless, there are also some positive sides of advertisement which cannot be ignored. It helps a business to develop and spreads awareness among people of the newly launched products and various promotional schemes introduced.
To conclude, it can be said that the pros of advertisement used are fewer than the misuse these days and so there should be some control done on them.
[259 words]
Outweigh (v): to be greater than something [synonym: outnumber, outperform, outdo]
Virtually (adv): almost
Alluring (adj) : attractive [synonym: tempting]
Deceive (v): cheat [synonym: con, fleece]
Shopaholic (adj): enjoying spending more time and money on shopping
Pester (v): trouble or annoy (someone) with frequent or persistent requests or interruptions
[synonym: harass]
Treasure trove (n): valuable things that are often hidden
Some people think it is better for children to grow up in the city, while others believe that life in the countryside is more suitable for them. What are the advantages and disadvantages of both places?
It is a matter of discussion whether a town is the best place to bring up children or the city life has something worthwhile to offer. There are some merits and demerits of both the areas
The benefit of raising children in the countryside is that they live in the lap of nature, so the value of flora and fauna is imbibed naturally. Another advantage is the pollution-free environment and fresh fruits and vegetables which contribute to the health and a robust immune system. The most significant point is, the children are bred with affection and social ethics which makes them disciplined and responsible citizens. However. unlike the metro children, they become shy and incompetent with the world, considering the required pace and agility. Also, their diffidence restricts them from opening windows to opportunity in spite of the ability.
On the other hand, the quality of education in metropolitan areas tends to be superior. The scope of learning through a range of academic and non-academic learning programmes induces multiple skills required to sustain the stiff competition in the market. Students get the opportunity to explore their talents because of the hi-tech infrastructure, sports facilities, dance and music academies and others. At the same time, the city life is highly competitive, so people lead an uncertain and stressful lifestyle. Security and loneliness become some other threats to the city-dwellers.
To conclude, growing up in rural areas can be positive for the aesthetic self and health in childhood, but metros offer a better opportunity to develop talent and boost a growing personality.
(260 words)
worthwhile (adj): valuable. important
lap of nature (phrase): close to nature, exposed to natural habitat
flora and fauna (noun): plants and animals
Imbibed (verb): absorb. soak up, take
robust (adj: strong
ethics (noun): morality, principles
incompetent (adj): unskillful, unprofessional
agility (noun): to move quickly
diffidence (noun0: hesitancy, modesty, shyness
opening windows to opportunity (idiom): there is an opportunity
induces (v): generate, produce
stiff (adi): hard, rigid
aesthetic (adj: the appreciation of beauty
- Essay 1
- Essay 2
Many people hold TV and other media responsible for making children unruly and rebellious these days. What other reasons do you think are there for children becoming rebellious and unruly? What do you think can be done to stop these kinds of influences on children?
It is a fact that watching too much TV and excessive exposure to the internet can make children aggressive. Nonetheless, the influential factors are more wide-ranging than television alone.
A significant reason for unruly behaviour among children, especially teenagers, is the desire to belong to a group. In today’s world, such acceptance comes. with the things one flaunts. For example, if friends go to school by bike, a child also wants the same and pesters his parents. When his desire is not satisfied, he throws a tantrum. Once parents submit to such behaviour, it may become a habit. So the peer pressure and the pampering done by the parents, makes a child misbehaving.
Furthermore, the generation gap plays a major role. This has caused a gulf between paradigms of parents and children. There are certain sets of behaviour which are acceptable to the young generation but abominable to the old generation. To illustrate, staying out till late night may be typical for youngsters but it seems to be a severe blight to the past age
Shielding children from undesirable influences is undoubtedly a tall order but not an impossible task. Parental control and development of self-identity are required to manage peer pressure. Children should be taught with desirable values and morals. The undeniable presence of generation gap and difference of opinion have to be tackled wisely by the attempt to adjust and accept from both sides
In short, TV and media should not be mistaken to be the only factor influencing children negatively but some other factors are also to be blamed which can be controlled by taking some preventive measures.
(271 words)
submit (v): not to be able to fight an attack, illness, temptation etc
pester (v): to annoy somebody by asking them something many times
tantrum (n): a sudden short period of angry, unreasonable behaviour especially in a child
gulf (n): a large difference between two people
paradigm(n): a typical example or pattern of something
abominable (adj): extremely unpleasant and causing disgust
blight (n): something that has a bad effect on a situation, a person’s life or the environment
shield (v): to protect somebody from danger
tall order (idiom): a very difficult task
Obesity is a major problem prevailed among modern children. What are its causes and what solution can be offered?
Nowadays, the increasing rate of overweight children and adults is a worldwide health issue. Obesity is a significant threat engulfing young children in its vice-like grip.
The leading cause of obesity is eating unhealthy foods. It is often seen that most children are fond of pizza, burger and coke which are readily available to them in the shops and school canteens. Moreover, with both parents away at work in many homes nowadays, takeouts or ready-to-eat foods are a convenient choice. These foods are high in carbohydrates and low on nutrition contributing to weight gain and related diseases, obesity being just one among them. Additionally, a seat-bound lifestyle intensifies the overweight problem. Due to technological advancement, children spend most of their time either watching television or playing video games on the computer. This has reduced the level of physical activity in youngsters.
This problem can be resolved primarily by adding nutritious value to meals, both at home and at school. Vitamins, minerals, and roughage must be consumed in regular quantity. Parents involvement is required to ensure and regulate healthy eating habits in growing children. Physical exercise through sport should be compulsory at school. Also, the awareness for healthy eating will result in the best. So, banning junk foods and fizzy drinks and replacing them with milk, fruits and fresh juices must be encouraged wherever and whenever possible.
As they say, “You are what you eat”, parents, school and the state have to work hand in hand to create and nurture the healthy eating habit and the will among children to grow into a sound, healthy adults full of vim and vigour.
(270 words)
engulfing (v): absorb, engross, soak up
vice-like (adi): very firm hold, a very strong pain fond of (adj): liking for. love of
seat-bound (adj): inactive, Sedentary
roughage (n): fibrous, indigestible material in vegetable
banning (v): block, stop, prohibit
fizzy (adj: carbonated, gassy, bubbly
you are what you eat (phrase): it is important to eat healthy to be healthy
work hand in hand (idiom): work closely with a common goal
vim and vigor (n): energy, enthusiasm, strength
- Essay 1
- Essay 2
Seeing that this is an age of technology, we cannot dispense with technology. However, others argue. Discuss and give your opinion.
Technology has become a part and parcel of our lives nowadays. We have become so much habituated to using technology that we cannot wean ourselves off it.
To begin with, technology has inextricably interwoven itself into our lives, and most of our jobs at home or work are done with the help of technology.
Moreover, it is evident that we cannot even imagine a day of our lives without any technological support. For instance, a mobile phone, a car, a computer, neon bulb, a lift, a simple stapler or alarm clocks are nothing but an outcome of some technology.
Though some concerns regarding the threats posed by technologies are also not out of place. The technology is giving rise to many problems like over-dependency on the machines for the house and office work. Another risk is rising e-crimes. With the increase in technology, there is a constant watch on all of our activities without us being even aware of it which gives rise to many crimes like identity fraud, cyber theft and so on.
I firmly believe that if we are deprived of technology, a significant number of facilities will stop. I am confident that nobody would like to go back to the Dark Age. For instance, the means of communication and travelling, the accurate computerised diagnosis results and a wide range of data collection in a small storage chip are some of the facilities people would not like to leave
To conclude, the benefits of technology are endless. However, some appropriate measures must be taken to curb its misuse, and with some positive encouragement, we can harness technology for the development of the world
(276 words)
part and parcel (idiom): a necessary feature of a particular experience, which cannot be avoided
wean somebody off something (phrasal verb): to make someone gradually stop using something that is bad for them
inextricable (adi): unable to be separated, released or escaped from
stone age: describes something which is very basic, simple and not well developed
the dark ages: a time in the past considered to be not advanced and when people were unwilling to accept the beliefs or opinions of others
battle (v): fight
curb (v): control
harness (v): to control something, usually in order to use its power
Some people often say that they work better under pressure while others believe that this is just an excuse given by people who have a tendency to procrastinate or delay work. Discuss both the views and give your opinion.
The act of procrastination is profoundly harmful for the effectuation of desired consequences, but at the same time, there is a considerable amount of population that thrives better in the nick of time, under external constraints. There are different ways how different individuals function and in this case, both the views carry strong lines of reasoning.
The outturn of stress may be positive for some people, and there is an affirmative chance that they might be all the more productive under moderate pressure. Consequently, employers categorise this as an employee skill as work conditions are prone to abrupt variations which might require quick time management abilities clubbed with quality labour over shoddy work. The so-labelled procrastinators prove to be more prompt in making accurate decisions than the ones who are threatened by advancing deadlines and unforeseen adverse conditions
Although this tendency might not be a complete hoax, there may be significant odds that many use this as a cover-up for their slothful attitude and put away tasks until it is too late. Moreover, these might be the populace who may not produce the desired outcome and fail to deliver to the ever approaching deadlines. The procrastinating hypothesis can also be applied to explicate that despite the fired up action can bring about better results, who is to say that the remaining time will suffice.
To a significant degree, the inclination to postpone given work to the eleventh hour can be a drawback. However, to label a whole horde of people as procrastinators is unfair bearing in mind that these might be the favoured ones.
(264 words)
procrastination (n): the action of delaying or postponing something
effectuation (v): to cause or bring about (something) into effect or operation
thrives (v): prosper; flourish
nick of time (phrase): just before the last moment when something can be changed
constraints (n): a limitation or restriction
shoddy (adj): badly made or done
hoax (n): a humorous or malicious deception
slothful (adi): lazy
hypothesis (n): a supposition or proposed explanation made on the basis of limited evidence as a starting point for further investigation
explicate (v): analyse and develop (an idea or principle) in detail
the eleventh hour (idiom): Just in time; at the last possible moment
- Essay 1
- Essay 2
Sportsmen are paid more generously than doctors, teachers and engineers, who make a substantial contribution towards a nation's development. How far do you think this is justifiable?
All professions, ultimately enrich a nation’s economy and facilitate its development. However, because of some circumstances and preconceptions, some professionals such as sportsmen are paid heftily, whereas teachers, doctors and other professionals are paid less which, in my view. is not justifiable
The first factor to be considered is, despite the hard work and significant contribution to a country, the doctors, engineers and teachers are not rewarded wisely. After a great deal of tribulation, a teacher shapes the citizen of a nation and makes him capable of contributing towards the nation’s progress Similarly, a farmer ploughs his field to feed the people of the country, and if he drops his plough, thousands of stomachs will remain empty. Surprisingly, farmers, masons, plumbers, electricians and other professionals are treated as minions who have no say in the system.
On the other hand, no doubt, sports bring fame, but the achievements of sports competitions are nothing but a few world cups and medals, which cannot be used even to sip tea from or to feed the poor. Moreover, nobody has ever heard of any country dying because its sportsmen stopped playing. Some sports enthusiasts argue that sportsmen deserve more money because they take the risk and compromise their leisure time. Also, they do not have a regular job However, it is known that sportsmen line their pockets by match-fixing and other such malpractices. I take such incidents as an unpardonable humiliation of a nation.
In conclusion. I firmly believe that the massive amount of money being forked out for sportsmen is gravely unjustifiable and government ought to make better use of its coffers
(270 words)
facilitate (v): to make an action or a process possible or easier
pre-conceptions (n): an idea or opinion that is formed before you have enough
information or experience [synonyms: presumption, assumption]
hefty (adj): (of an amount) large
tribulation (n): great trouble or suffering
minion (n): an unimportant person in an organisation who has to obey orders, servants
have no say (idiom): have no opportunity to express themselves
line your pockets (idiom): to become richer by taking unfair advantage of a situation
unpardonable (adj): that cannot be forgiven [antonyms: forgivable, pardonable, and excusable
fork out (phrasal verb): spend [synonym: splash out, shell out]
gravely (adv); seriously
coffers (n): all the money that a government or an organization has available to spend
Playing sports can be dangerous but not playing any sport can be even more dangerous. What is your stand on this view? Why?
In this technology-driven world, a lot of tasks are performed by machines resulting in a sedentary lifestyle. Consequently, playing sports does not remain only a hobby anymore, but has become a mandatory ritual of our daily regime. Playing sports can pose some dangers, but I believe, playing no games will be more dangerous.
Playing sports is the best way to keep the body and mind healthy. Now that people do not walk to work and many household chores are done by machines, people have little scope to exercise or to burn calories naturally, and surplus calories cause obesity Considering the modern lifestyle, playing sports is the most suitable form of exercise for fitness. It is also an effective way to release stress and anxiety.
Furthermore, playing sports inculcates sportsmanship and discipline. Some team sports teach us time management, agility, teamwork and coordination, which are important life skills. Besides, it also teaches us a positive attitude to realise that playing a sport with maximum zest is as important as winning.
Every defeat teaches us a skill to avoid our mistakes and galvanises us into ardent striving for our victory.
On the other hand, some people avoid sports for fear of injury or risk to life. However, playing a sport carefully can avert any fatal injury. Though the apprehension is reasonable to some extent, I think abandoning sports altogether will be a disaster.
Thus, playing a sport is not as much a risk as avoiding it since a life without physical activity for fitness is already posing a threat for the current generation.
Sport is enjoyable with a dual benefit for its sake and also for a healthy mind and a healthy body.
(281 words)
mandatory (adj) : compulsory
surplus (adj): more than what is needed or used
agile (adj): able to move quickly and easily [synonym; nimble]
zest (n) : enthusiasm [synonym: zeal, fervour]
galvanise (v): to make some somebody take action by shocking them or exciting them
ardent (adj: very much enthusiastic [synonym: passionate]
strive (v): to try very hard to achieve something
avert (v): to stop [synonym: prevent]
fatal (adj): causing death [synonym: deadly, lethal]
abandon (v): to stop doing something
- Essay 1
- Essay 2
Compare and contrast distance education with conventional education.
In this modern world, success is evaluated by the education and profession an individual possesses. In spite of having jobs, people still aspire to get further education in order to better their prospectives. Although the exponents of regular education have vociferously expressed their misgivings about it, the concept of distance education is gaining popularity. Both the ways of gaining education have certain similarities and differences.
First of all, considering the similarities, the purpose of conventional education and distance education is imparting knowledge. The students in both the study styles are provided with quality study material which helps them in understanding and interpreting the course easily and in learning what they need.
Such acquired knowledge helps students transform themselves and become skilful with a prestigious degree to fetch better job opportunities.
However, there are some differences between both study patterns which create a gulf. The unique selling point of distance education is its flexible learning. In other words, as the learning and earning can go hand to hand, so for the students, attaining a degree without giving up the current job is possible. Whereas, with conventional education, this is not possible. Conventional education too has its own benefits as it is imparted through regular classes which provides an extensive and strong understanding of the course. Apart from this, it offers personal interaction and customised guidance to strengthen the concepts and develop a bond between students and teachers. Also, the academic environment gives valuable exposure and breeds a healthy competition and teamwork among the learners.
In conclusion, both the ways of acquiring education have their own benefits. The ultimate goal is to gain a higher degree and therefore either can be used, depending on the learners’ needs and situation.
(287 words)
Aspire (v): to have a strong desire to achieve or become something
Exponent (n): a person who supports an idea, theory, etc. and persuades others that it is good [synonym: proponent, advocate]
Vociferous (adi): expressing your opinions or feelings in a loud and confident way [synonym: strident]
Compare and contrast English medium schools with the schools where education is imparted in the native language.
The concept of an ideal medium of education varies from person to person due to a range of factors, ultimately influencing the selection of a school for a child. There are various similarities as well as differences between teaching in English medium and in vernacular medium
Firstly, focusing on the standard features, the primary objective of both the schools is to educate students with the designed academic structure approved by the education board of the country. The framework in both types of schooling includes a range of subjects and extracurricular activities. Similarly, some values such as tenacity, individualism, liberty and originality are bred in schools. Consequently, a child is imbibed with social manners, dressing sense, body language and courtesy as he functions in a formal environment.
On the other hand, there are certain differences between the ways of learning. A child educated through his mother tongue is more deeply rooted in his own culture. This learning makes him feel a sound affinity with the matrix he lives in, which is indispensable for national integrity. But the negative factor is, instead of a global citizen, he ends up becoming merely a local citizen. While in schools where the medium of instruction is English, students naturally get exposed to western thoughts and culture. Thus, students own a broad outlook toward life. However, some less favourable traits are entrenched in students through such education, especially when the medium of instruction is given undue importance, those students become snobbish and phoney and are confronted with culture clash.
Hence, though both the types of schooling are different and have their pros and cons, we can get the best of them by focusing on the objective and judiciously modifying these two systems of education.
(288 words)
tenacity (n): the determination to continue what you are doing
imbibe (v): to receive and accept information, etc
affinity (n): liking or sympathy for someone or something
matrix (n): the set of conditions which provides a system in which something grows or develops
entrench (v): to establish something, especially an idea or a problem, firmly so that it cannot be changed